>>Return to Tell Me About Statistics!
Survival analysis methods include the Kaplan–Meier method and Cox proportional-hazards model. These methods are typically used to compare two groups: one in which a certain event occurred and another in which the same event did not occur, considering the temporal element.
The objective variable, or outcome, is data categorized in two groups, such as death/survival (relapse/no relapse, remission/no remission, etc.).
In this article, you will learn about these two methods of survival analysis.
Kaplan–Meier method
Here is a simple case in which the outcome is death/survival.
In this case study, to improve the prognosis of patients with recurrent cancer, in addition to conventional standard treatment, 424 and 464 patients were administered with product A and placebo, respectively, and were followed up for 36 months.
All patients were healthy at the start of treatment. However, the cancer progressed, and the percentage of patients who died increased; the survival rate decreased over time.
[Figure] Kaplan–Meier survival curve (Omit n numbers)
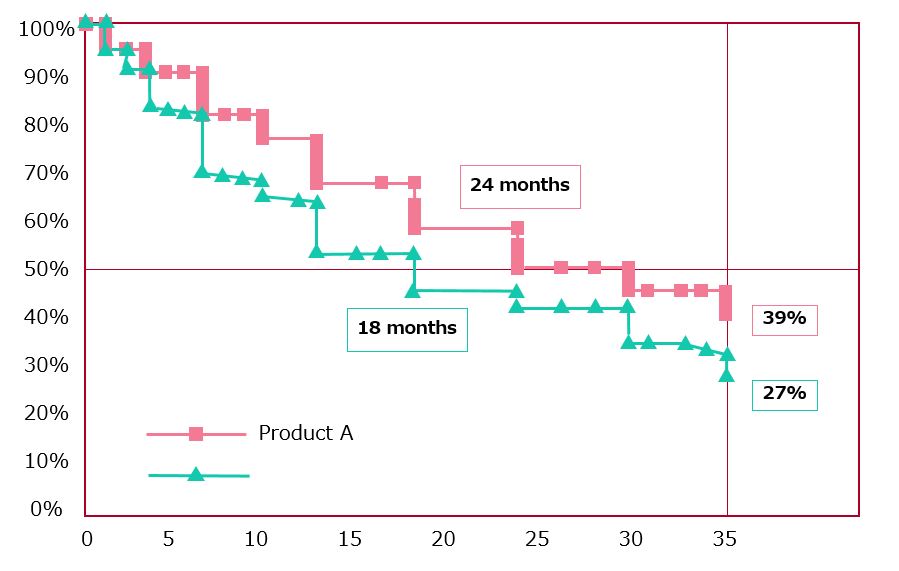
The Kaplan–Meier method was used to calculate the survival rates of the groups administered product A and placebo and to plot a graph. The difference in survival rates between the two groups was examined to determine the effectiveness of product A in improving survival.
Cox proportional-hazards model (Cox regression model)
The Cox proportional-hazards model is used to create an equation that relates sex, age, and explanatory variables (such as stage of disease), which affect survival, and ascertain factors that contribute to life extension from coefficients of the relationship.
By checking the effect of the administered drug (product A or placebo) on the explanatory variables, the life-prolonging effect of product A can be elucidated.
When analyzing survival, the Kaplan–Meier method only considers the presence/absence of events, such as death or recurrence, whereas the Cox proportional hazards model evaluates multiple factors.
Hazard ratios and 95% confidence intervals for hazard ratios are occasionally shown on Kaplan–Meier curve graphs but calculated using the Cox proportional-hazards model, regardless of the Kaplan–Meier curve.
>>Return to Tell Me About Statistics!

Comments are closed