>>Return to Tell Me About Statistics!
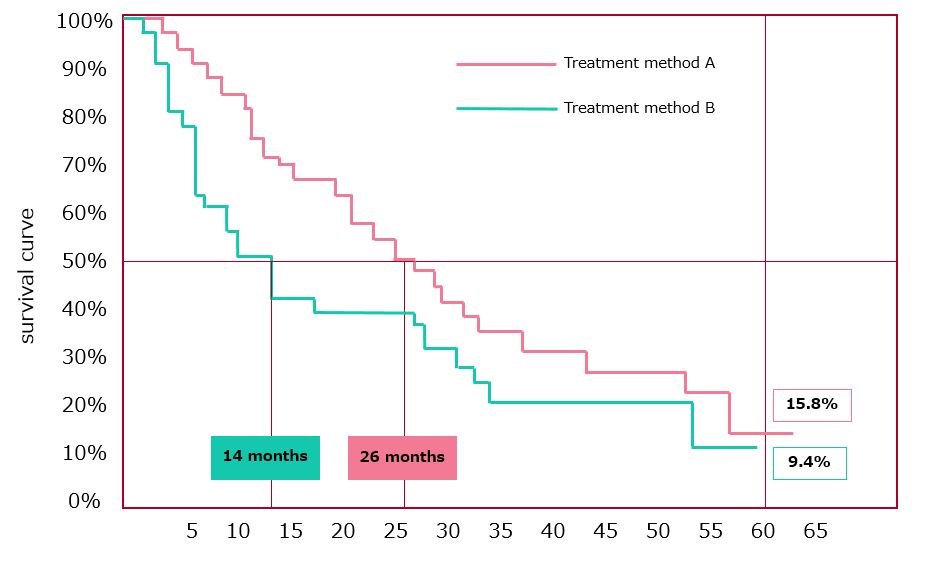
The Kaplan-Meier survival curve is an analysis method that calculates the survival rate of treatment methods A and B and draws a graph as shown in Figure 1. This is a method of investigating the difference in survival rate and grasping the life-prolonging effect of treatment method A.
The objective variable (outcome) will be categorical data for two groups of death/survival (sometimes relapse/no relapse, remission/no remission, etc.).
[Figure 1] Survival curves for treatment methods A and B
How to find out if there is a significant difference between the two groups in the survival curve?
Rather than comparing survival rates at a specific point (for example, 5-year survival rates), we compare overall survival curves to test whether there is a difference in survival between the two groups.
The log-rank and generalized Wilcoxon tests are applied to examine whether there is a significant difference between two groups in the survival curve.
The p-values produced in the tests imply that if the p-value is less than 0.05, there is a difference between the survival curves of the two groups.
Differences between log-rank test and generalized Wilcoxon test and when to use them
The log-rank test conducts the calculation with the assumption that the mortality rates by time are similar at all time points.
On the one hand, the generalized Wilcoxon test conducts the evaluation by weighting the number of deaths by time period, assuming that “the first one is more reliable because it has more cases and the second one is less reliable because it has fewer cases.”
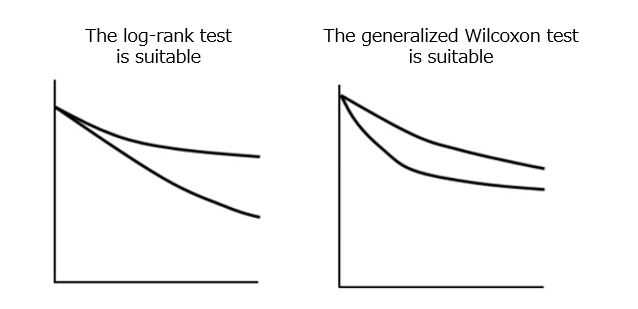
In Figure 2, the log-rank test is more suitable for the type of result in which “the survival curves of the two groups open up as time passes,” as shown in the left figure. On the other hand, as shown in the figure on the right, the generalized Wilcoxon test is more suitable for results in which “the difference between the two groups gradually shrinks even if a difference is observed during the observation period.”
[Figure 2] Test suitability of log-rank test and generalized Wilcoxon test
In Figure 1, the 60-month survival rate for treatment A is 15.8% and treatment B is 9.4%. The difference was 6.4 points, and it can be interpreted that A was more effective in prolonging life than B.
Also, the time taken till half (50%) of the patients died was 26 months for A and 14 months for B, that is, a difference of 12 months. It can be interpreted that A had a life-prolonging effect compared to B.
The survival curve is similar to the right panel in Figure 2, thus, the generalized Wilcoxon test seems to be a better fit. Therefore, the p-value calculated by the generalized Wilcoxon test is 0.0303. Since it is less than 0.05, it can be said that there is a difference in the survival curves of treatment methods A and B.
>>Return to Tell Me About Statistics!

Comments are closed