
What determines how low a Kaplan-Meier survival curve ends up at late time points?
If there are no censored observations and all subjects die
If you follow each subject until the event occurs (the event is usually death, but survival curves can track time until any one-time event), then the curve will eventually reach 0. At the time (X value) when the last subject dies, the percent survival is zero.
If all subjects are followed for exactly the same amount of time
If all subjects are followed for the same amount of time, the situation is easy. If one third of the subjects are still alive at the end of the study, then the percent survival on the survival curve will be 33.3%.
If some subjects are censored along the way
If the data for any subjects are censored, the bottom point on the survival curve will not equal the fraction of subjects that survived.
Prior to censoring, a subject contributes to the fractional survival value. Afterward, she or he doesn't affect the calculations. At any given time, the fractional (or percent) survival value is the proportion of subjects followed that long who have survived.
Subjects whose data are censored --either because they left the study, or because the study ended--can't contribute any information beyond the time of censoring. You don't know whether or not they would have died after the time of censoring (or do know, but can't use the information becauase the experimental protocol was no longer being followed). So if any subjects are censored before the last time shown on the survival curve's X-axis, the final survival percentage shown on the survial graph will not correspond to the actual fraction of the subjects who survived. That simple survival percentage that you can easily compute by hand is not meaningful, because not all the subjects were not followed for the same amount of time.
When will the survival curve drop to zero?
If the survival curve goes all the way down to 0% survival, that does not mean that every subject in the study died. Some may have censored data at earlier time points (either because they left the study, or because the study ended while they were alive). The curve will drop to zero when a death happens after the last censoring. Make sure your data table is sorted by X value (which Prism can do using Edit..Sort). Look at the subject in the last row. If the Y value is 1 (death), the curve will descend to 0% survival. If the Y value is 0 (censored), the curve will end above 0%.
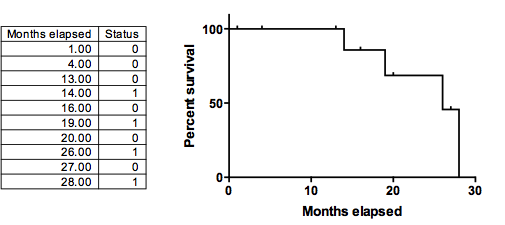
In the example below, four of the ten subjects die. But the survival curve descends to zero, not to 60%. Why? Because six subjects were censored between 1 and 27 months. We have no idea what would have happened had they stayed in the study until month 28. Since we don't know if they would have lived or died, their data simply doesn't count after the time of censoring (but definitely counts before that). So at time 27 1 subject is left, and she or he died at month 28, dropping the percent survival down to zero.
Keywords: Kaplan Meier Kaplan-Meier Kaplin Meyer