Case Study: 2003-7 Uranium-Paladin bubble & bust. Before jumping into the next bubble, what can we learn from the last one?
Ashley Owen (CFA)
Investment research & analytics, portfolio construction & management, asset allocation
With the lithium bubble bursting, I am now receiving emails from readers (and hot stock tip-sheets) about how to jump in on the latest ‘hot’ commodity – uranium, as a possible solution in the transition from fossil fuels.
Uranium prices have doubled in the past six months, and so have share prices of uranium stocks, including Australia’s ‘pure-play’ uranium stock: Paladan Energy (ASX:PDN).
Before following the crowd and jumping to what is being touted as the ‘next big thing’, it might be wise to see what happened in the last great uranium bubble and bust.
This was only a few years ago, and it starred the same company, Paladin. (Actually, todays’ Paladin is the remnants salvaged from the wreckage of Paladin before it collapsed in the last uranium boom/bust.)
It is a classic example of the four key elements in all commodities boom-bust cycles – demand, supply, time lags, and debt.
Demand is relatively easy – but that’s not where the action is
Most investors focus on the demand side of the commodities equation – the demand for energy, industrial metals, motor vehicles, batteries, crops, wine, and so on. These are usually driven by growth in population, living standards, demographics, urbanisation, etc.
The problem is that almost all of the swings in commodities prices (and share prices of commodities-related stocks) are driven by what happens in the other three factors: supply, time lags, and debt.
The four stages of all commodities cycles
Throughout history going back many centuries, commodities cycles have gone through four main stages:
Stage 1
Prices start rising as demand exceeds supply, which has been kept low by a lack of exploration, development, and production due to low prices in the glut at the end of the previous cycle.
Very often the initial price rise is caused by a sudden supply restriction (eg a workers’ strike, natural disaster, mine accident, political decision, pandemic lockdown, etc).
Stage 2
Miners see prices rising and start (or re-start) exploration, development, and production. The higher commodities prices make lower quality, marginal deposits, and previously mothballed mines suddenly become viable again.
Due to the time lags between exploration, approval, financing, construction, and production, demand still exceeds supply, so commodities prices keep rising.
Speculators jump in because they see rising prices as proof of their theory on rising demand. (It’s not. It’s just the time lags for supply to catch up to demand). Rising prices pull in even more speculative investors, sending share prices even higher.
Stage 3
New production comes on stream from all of the new the developments, after time lags, and catches up to demand, and/or the temporary supply restrictions are resolved. Prices peak.
Often this is also the time when demand slows, either because of a cyclical slowdown, or because high prices themselves cause demand to slow, or switch to lower cost substitutes.
Stage 4
The rush of new supply swamps demand, and prices fall.
Producers cut production, mothball mines, cease new exploration and new development. Highly geared producers default on debt and collapse. The supply glut keeps prices low until excess supply and stockpiles are eventually soaked up. this often takes many years.
This pattern is almost always the same in every commodity boom. As with all forms of investment, timing is everything!
Australia: home of commodities booms & busts!
Australia is the home of commodities cycles and speculation, from the first copper boom in South Australia in the 1840s.
This is not our first uranium cycle. The first uranium boom was from 1973 to 1978 which collapsed in the early 1980s. On that occasion the uranium bubble stock du jour was Pancontinental – but we will save that story for another day.
Here we take a look at the next uranium bubble in 2003-7, staring Paladin. After massive losses for shareholders and creditors in that bubble, the new re-born Paladin is suddenly now the so-called ‘next big thing’ today.
Paladin ‘mark I’ in a nutshell
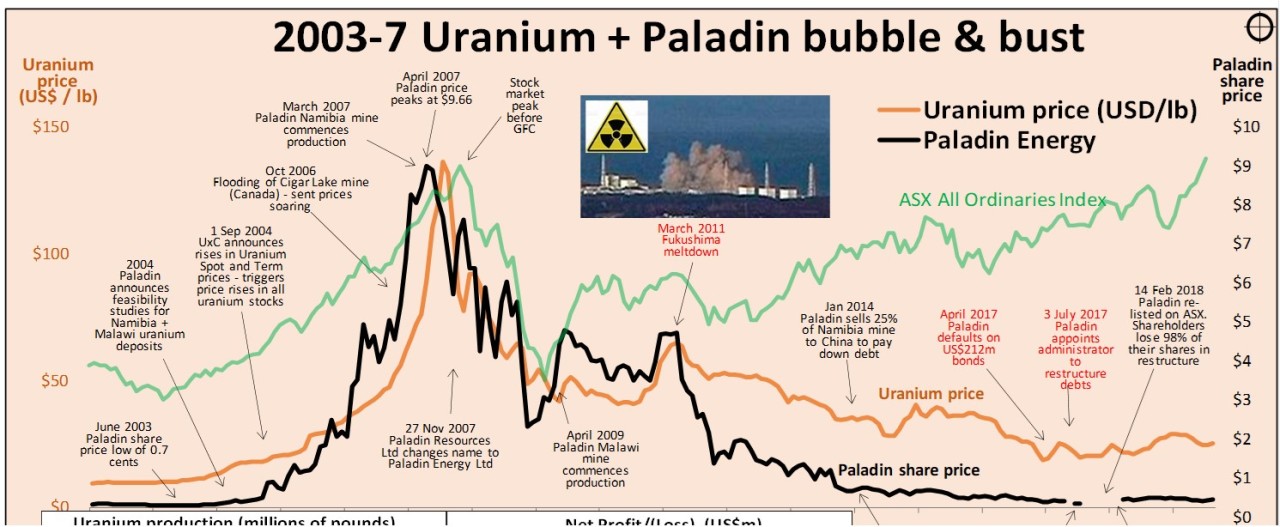
In the last great uranium bubble, the original Paladin went from 0.7 of a cent per share in 2003 to $9.66 in just 3 years (a gain of +140,000%).
It produced 53 million pounds of high-grade uranium, earned $2.4b in revenues, but it never made a profit, never declared a dividend, and it collapsed into administration in 2017 owing US$676m to creditors.
What went wrong?

Where it all started
Paladin had its origins in 1970 as a German firm called ‘Uranerz Australia’ based in Perth that scoured the world for uranium. After the Germans sold out to the world’s largest uranium producer Cameco (Canada) in 1991, its CEO John Borshoff bought the exploration database and floated Paladin Resources on the ASX in 1994, raising $7m from investors at 20 cents per share. (It changed its name to Paladin Energy in 2007).
After the 1994 float the share price immediately started falling and it kept falling over the next nine years. The 1990s was the decade of new technology and new ideas (the internet, ‘dot-com’ stocks). Commodities prices fell, and mining stocks were shunned as ‘old world’ relics. (Likewise, the AUD fell as an ‘old-world’ commodities currency relic).
Paladin’s share price kept falling to a low of just 0.7 of a cent in the middle of 2003, right before at the start of the great 2003-7 China/commodities/credit boom.
What caused the share price bubble? Commodity stocks are essentially a leveraged bet on the commodities price (operational leverage due to the company’s fixed cost base, and financial leverage in the form of gearing).
As always, commodities prices driven by demand, supply, and the lead-times for supply to catch up to demand.
On the supply side, all mining commodities are subject to long lead times between exploration, feasibility, approvals, development and finally production. For Uranium, the lead times are even longer than most, due to the additional political and environmental hurdles for nuclear materials. Uranium prices had been falling along with other commodities all through the 1980s and 1990s.
Meanwhile, demand kept rising and stockpiles were being depleted, but the supply pipeline was many years behind since exploration and developed had been shelved for a decade while prices were low. A classic Stage 4 glut.
Stage 1 of new cycle – prices start to rise
By 2003, excess stockpiled supplies were being exhausted. Paladin’s share price started rising from September 2003, triggered by reports on feasibility studies for its promising uranium projects in Namibia and Malawi, and buoyed also by the general rise in interest in all commodities at the start of the China boom.
A year later the share price surged above 50 cents following a report by UxC (the main supplier of price data in the uranium industry) on 1 September 2004 that spot prices and long term contract prices of uranium were on the rise.
This sent share prices of all global uranium explorers and producers (mostly Canadian) soaring well ahead of the rising uranium prices in 2004 and 2005.
Prices doubled again after the flooding of the Cigar Lake mine (Saskatchewan), which was being developed into the world’s largest high-grade uranium mine.
Meanwhile, Paladin was busy developing its first mine (‘Langer Heinrich’ in Namibia), which was the world’s first new uranium mine in a decade. Paladin’s share price peaked at $9.66 in April 2007 (up 140,000% from its June 2003 low and up +4,700% from its 20 cent IPO price) just as the Namibia mine started producing.
‘Buy the blue sky – sell the mine’
This is a very common phenomena with speculative mining shares - ‘Buy the blue sky, sell the mine!’ Speculators love the ‘blue sky’ potential of the great unknown. However, once a mine actually starts producing, it becomes a ‘known quantity’ and the ‘blue sky’ excitement evaporates, along with the share price, as speculators move on to the ‘next big thing’.
Uranium prices peaked at $136 per pound in June 2007, up +1,250% from $10 in 2003, but then collapsed, taking uranium stock prices with it.
Why?
First, the prices of all commodities collapsed along with share prices in the 2008-9 ‘global financial crisis’. Uranium prices fell in the 2008-9 crash and then started to recover in the 2009-10 rebound.
However, there was a larger problem.
Fukushima tsunami
While new supply was being brought into production, demand for uranium was slowing. The key turning point was the Fukushima nuclear disaster caused by the Japanese tsunami on 11 March 2011.
This triggered widespread shutdowns of nuclear reactors in Japan and also Germany. It led to a global re-think about the future of nuclear as a major power source, and the cancellation or shelving of dozens of nuclear reactor projects. With demand weakening and supply increasing, uranium prices collapsed.
Malawi mine
Paladin’s second mine (‘Kayelekera’ in Malawi) started producing in April 2009 but was it closed in February 2014 due to the collapse in uranium prices. Paladin’s problem was not just falling uranium prices. After all, the uranium price was still four times what it was when the company started developing the mines.
Debt, default, shareholder wipe-out
The problem was debt. Paladin ran up huge debts developing mines and was losing money each year. In April 2017 it defaulted on US$212m of debt owed to France’s power utility EDF, its main customer.
On 13 June 2017 its shares were suspended from the ASX and on 3 July 2017 it was put into administration owing US$676m.
To avoid liquidation, a debt-for-equity swap was agreed in which 98% of the existing shareholders’ shares were transferred to creditors. The remaining shares were re-listed on 14 February 2018.
The Namibia mine was also closed down in May 2018, leaving both of its mines boarded up waiting for uranium prices to recover once again.
By 2020, Paladin’s shares were trading at 10 cents, but after the restructure each new share is effectively worth just 1/50th of one original share, so one 10 cent new share was really worth only 0.2 of a cent. In 2021 the company raised A$219m in new equity to repay US$115m in debt.
Despite producing and selling 53 million pounds of high-grade uranium worth $2.4b in revenues, the company never made a profit and never paid a dividend. (The 'profit' posted in 2018 was caused by a $484m 'gain' on the extinguishment of debts in the restructure).
Paladin ‘mark 2’ - Blue sky stock once again!
Today, we are back in Stage 1 again, with uranium prices rising after the Stage 4 glut.
Uranium is suddenly no longer considered a dangerous threat to all human life on the plant, but is now seen as a clean, green saviour in the transition away from fossil fuels!
The new cleaned-up Paladin is now working on re-opening its old mines, and also has a bagful of new exploration projects, so it was once again a ‘blue sky’ stock.
For long-standing shareholders, being left with 1/50th of their original shares but some ‘blue sky’ potential is better than a liquidation where they would have received nothing.
Lessons
Here are some key lessons:
In commodities cycles, the demand side is relatively easy, but that’s not where the action is. The great price swings in the four stages of commodities cycles are caused by the other three key factors: supply, time-lags, and debt.
Understand which stage we are in, what is likely to trigger the next stage, and what the next stage is likely to bring.
Debt greatly magnifies the potential returns but also the potential losses. Get to know the debt in the company – amount, structure, terms, creditors.
Leveraged demand-supply-timing mismatches can cause huge price surges and collapses in which great fortunes are made and lost.
Generally, most of the money is made by insiders. By the time outsiders (ordinary investors) summon the courage to jump in, they like to have waited for prices to rise for a while, but that is often at or near the top. Likewise, they are also likely to hold on and not sell when prices fall. But, as commodities cycles can run for decades, it can be a very long wait for prices to recover, if ever.
If you buy in a bubble, hoping for prices to keep on rising, the odds of getting out before the inevitable collapse are very small. Buying decision are hard enough. Selling decisions are even harder!
‘Till next time – happy investing!
Thank you for your time – please send me feedback and/or ideas for future editions!

If you would like better versions of the charts, please email me. (I am using LinkedIn to publish stories pending my own web site, LinkedIn limits the resolution of charts.)
ps. I have never been a shareholder of either Paladin ‘1’ or Paladin ‘2’.
This is intended for education and information purposes only. It is not intended to constitute ‘advice’ or a recommendation to buy, hold, or sell and stock or security or fund. Please read the disclaimers and disclosures below.

.