Daylight study of Zonnestraal Sanatorium
Andreas Sørensen
Digital Lead in Sustainability | Computational Design | Building Performance Simulation | LCA | Daylight, Energy and Indoor Climate | Data Science | MSc. Eng. |
With this article, we would like to share our learnings from a daylight investigation of Zonnestraal Sanatorium using Honeybee/Ladybug tools to run Radiance in Grasshopper.
Drawings of the sanatorium were delivered by architect Wessel de Jonge, one of the lead architects on the renovation project of Zonnestraal that finished in 2010.
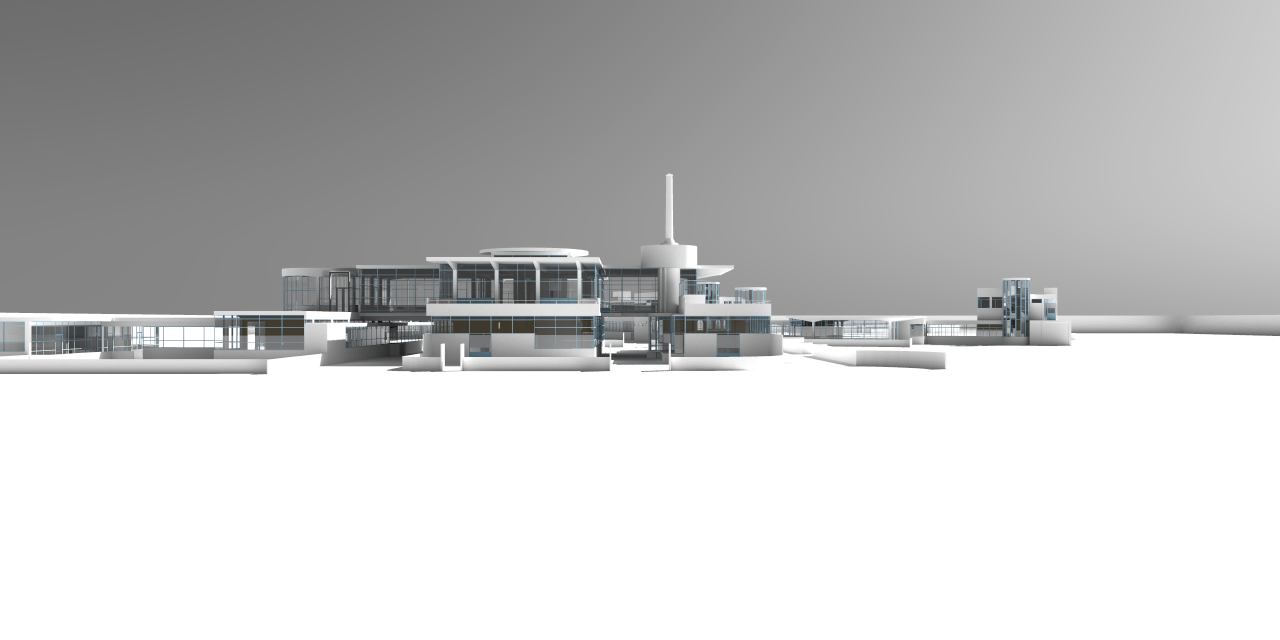
The 3D model was created in Rhino and comprises of three buildings: A central main building used for medical clinics, and two adjacent pavilions used to accommodate patients.

fig.1 Overview of Zonnestraal Sanatorium
Brief History
A Sanatorium is a health care facility from the early 20th century used to care for patients with otherwise untreatable and often fatal diseases. The rationale was that a regime of nutritious diet and exposure to nature, fresh air and daylight led to an improved immune system, thereby increasing chances of survival. Zonnestraal Sanatorium is an iconic example of one such building.
Daylight provision
The daylight provision of select rooms in Zonnestraal Sanatorium was evaluated using static and climate based metrics. The static metric, daylight factor, describes the relationship between the inside and outside illuminance intensity under a standard overcast sky from CIE. The climate based metrics, daylight autonomy, and useful daylight illuminance use dynamic sky conditions generated by annual weather data from a certain location.
Daylight Factor
Simulation of the daylight factor (DF) often involves, a grid of sensor points covering the space of interest, where the illuminance value at each sensor point is used to calculate the daylight factor at that point. The daylight factor can be visualized by color-coding sensor point values to get a better sense of the distribution of daylight. The daylight factor in the common space and the patient rooms is visualized below.

fig. 2 Visualized DF in the common space of the main building with a median of 9%

fig. 3 Visualized DF in the patient rooms with a median of 1-2%
Daylight Autonomy
Daylight autonomy (DA) describes the percentage of time for which the daylight levels are above a certain threshold. Three thresholds are used in the European Standard EN17037 to determine if a space is: adequately lit (300 lux), well lit (500 lux), or very well lit (750 lux). This can also be expressed spatially by looking at the spatial daylight autonomy (sDA), that describes the percentage of the analysed space that is above the threshold for at least half of the analysis period, in this case, half of the daylight hours. The daylight autonomy of the common space and the patient rooms with a threshold of 750 lux is visualized below.

fig. 4 Visualized DA in the common space of the main building with a sDA of 100%

fig. 5 Visualized DA in the patient rooms with a sDA of 0% in all rooms
Useful Daylight Illuminance
Useful Daylight Illuminance (UDI) is similar to daylight autonomy in the sense that it sorts the climate-based data based on a percentage of time. The difference is that this metric splits the data into several ranges instead of a single threshold. The ranges are; below 100 lux, between 100-2000 lux, and above 2000 lux. Splitting the results into several ranges allows a deterministic range where the illuminance values are optimal for visual comfort. Illuminance values below 100 lux are too dark while illuminance values above 2000 lux lead to a high probability of visual discomfort. Therefore, the range of 100-2000 lux has been defined as the useful daylight illuminance range. The useful daylight illuminance of the common space and the patient rooms is visualized below.

fig. 6 Visualized UDI in the common space of the main building with an average value of 44%

fig. 7 Visualized UDI in the patient rooms with an average value of 69%
Daylight Glare Probability
Great variations in light intensity can cause visual discomfort referred to as glare. Daylight glare probability (DGP) is a metric that predicts whether visual discomfort is present, and to what extent. This is determined from a high dynamic range image (HDRI) which can be used to widen the luminous range of an image. These images can be rendered to estimate glare from luminance levels. A fisheye perspective is used to simulate the peripheral view of an eye. The rendered images are used to create a DGP-score for a point in time or an average over several time steps with a certain sky condition. Below, the visual discomfort at a point in the highly glazed common space of the main building has been analysed. The analysis has been carried out at three different points in time of the day on March 21st to illustrate the significance of the sun’s position in the sky in relation to the view.

fig. 8 Glare study from a perspective inside the main building on March 21st.
Image Rendering
The use of metrics offers a quantitative approach to the evaluation of daylight quality. However, other qualities of daylight can’t be measured quantitatively, and thus other methods are needed for evaluation. To do so, images have been rendered to give a sensation of the incoming daylight and the view out to the surroundings. Rendering images also helps analysing the validity of the 3D model.

fig. 9 Radiance rendering of the common space in the main building

fig. 10 Radiance rendering from the top of the staircase in the main building

fig. 11 Radiance rendering from the bottom of the staircase in the main building
Conclusion
The facilities are designed with a large number of windows which have a great impact on the daylight provision. From the calculated daylight metrics, it can be confirmed that the building excels in distributing daylight within the main rooms of the building. The distribution of daylight to the patient rooms proves to be not as great when considering daylight factor and daylight autonomy. However, when looking at useful daylight illuminance, the patient rooms seem to perform significantly better than the common space.
It was shown, that in the highly glazed main room of the building, the risk of glare was present during several hours of the day. This correlates with the UDI results, that show lower percentages close to the glazing in the main room.
The varying performance of the analysed rooms across the different metrics, illustrates the need to include several different metrics when evaluating the quality of daylight in a space.
Learnings
The project acted as a playground for the different daylight studies in a very large and highly glazed environment. The learnings that have been made include how to make the analyses more time-efficient and accurate, but also how to communicate daylight provision results.
Rendering the images has been very time consuming, even with a relatively powerful computer with many cores. To solve these issues, different simulation settings have been tested as advised by experienced users. However, the main source of the issue was the sheer size of the model. To aid this, a recommended practice is to model what is in close proximity of the view in detail and what is further away as more rough geometry. In this project the same level of detail was applied to the whole model, making the visualization workflow somwhat inefficient, since only select rooms were chosen for the analysis.
Models and scripts are available upon request
Special thanks to Wessel de Jonge Architecten for providing architectural drawings.
Authors: Andreas Sørensen, Christian V. Bech and Nicolas Roy
--
11moHello, Can I get the model file?
Digital Practice at Schmidt Hammer Lassen Architects
4yGreat content! Well done guys, keep sharing
Interesting read, thank you Andreas! 🙏