The Phase of CO2 in Ice
This post examines the physical states of trapped gases in ice during various temperature and pressure conditions with depth. The objective is to determine the phase regions for CO2 in ice bubbles and whether CO2 intersects the CO2 triple point.
CO2 Phase Diagram
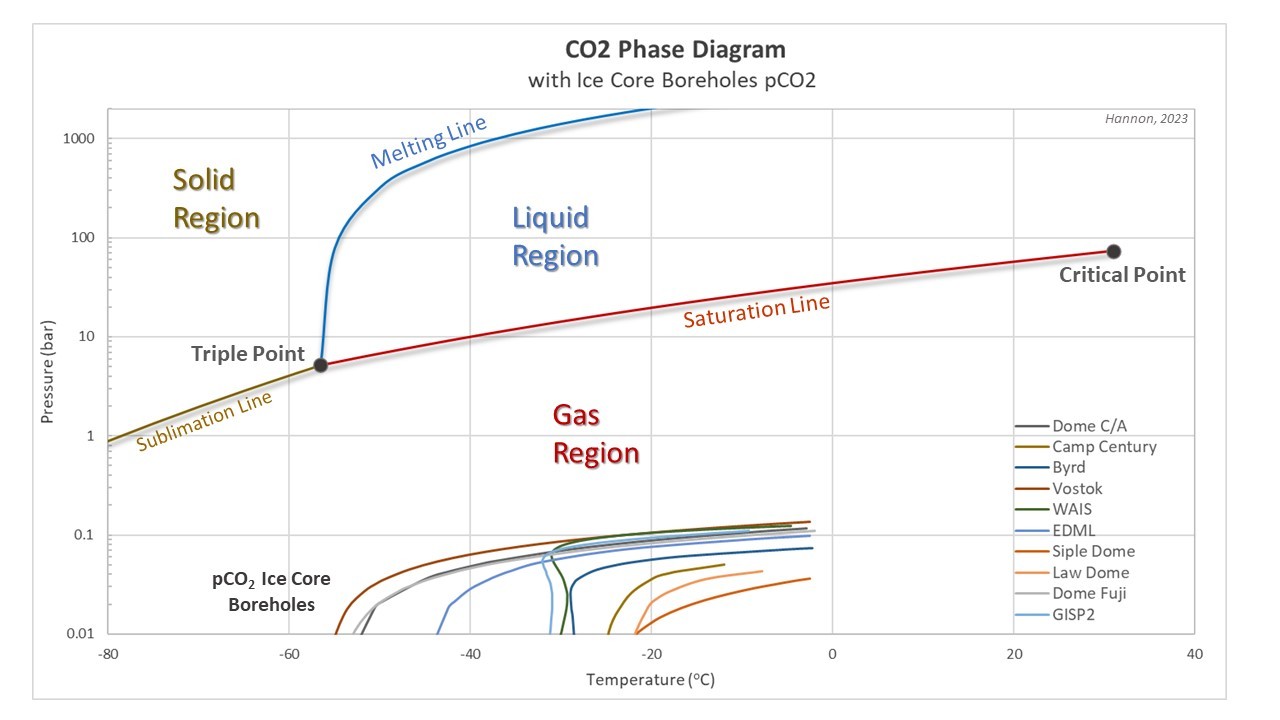
The CO2 phase diagram is a one-component phase diagram based on the function of temperatures and pressures in a closed system. Figure 1 shows the CO2 triple point at -56.6 deg C, 5.17 bar and a critical point at 31 deg C, 73.7 bars. The triple point pressure is above 1 atm, or 1 bar, indicating CO2 does not exist as a liquid at ambient atmospheric conditions. Solid CO2, or dry ice, sublimes at temperatures warmer than -78 deg C at atmospheric conditions. As pressures increase above 5.17 bars and temperatures increase, the gas phase of CO2 condenses to a pure liquid phase above the vapor saturation line.

Ice cores are acquired in ice sheets where in situ temperatures range from -60 deg C near the surface to -2 deg C near the bedrock. Borehole overburden pressures increase to almost 350 bars with depth. These ranges appear to place trapped gases within the deeper sections of ice cores well above the gas-liquid CO2 saturation line and into the pure CO2 liquid region on the CO2 phase diagram.
Bender, 1997, states that gases trapped in ice core bubbles are close in composition to atmospheric air. The volume of the four key gases comprising air according to NOAA are 78% nitrogen, 21% oxygen, 0.93% argon and only 0.04% CO2. As the kind Dr. Happer informed me, partial pressures of CO2 from the ice bubbles should be plotted on pure CO2 phase diagrams and not total overburden pressure.
The following equation was used to determine partial pressures according to Dalton’s law:
pi = P x Fi
where:
pi = partial pressure of gas component i
P = total pressure
Fi = volume fraction of gas component i = mole fraction
Partial pressure = (total absolute pressure) x (volume fraction of the gas component)
For example, ice cores experience a maximum total pressure of almost 350 bars. The sum of the partial pressure of each gas in the mixture will equal the total pressure. The partial pressures for the key gases trapped in ice at this maximum pressure are the following:
pN2 = 350 bars x 0.78 = 273.0 bars
pO2 = 350 bars x 0.21 = 73.5 bars
pAr = 350 bars x 0.0093 = 3.25 bars
pCO2 = 350 bars x 0.0004 = 0.14 bars
The total pressure does not quite add up to 350 bars due to rounding and the presence of other trace gases. Figure 2 shows the temperatures and partial pressures of CO2 for ice core boreholes from both Antarctic and Greenland plotted on the CO2 phase diagram. Note the y-axis scale change from Figure 1.

Since ice boreholes experience a maximum total pressure of 350 bars, the maximum pCO2 in ice is only 0.14 bars and is always within the gas region and not even close to the CO2 triple point at 5.17 bars.
Conclusions
Total overburden pressures for mixed gases in ice are not valid on pure gas phase diagrams. Partial pressures for the gas must be plotted on the appropriate phase diagram to determine its phase. Partial pressures for CO2 demonstrate that CO2 in ice is within the gas phase region at all depths within the ice core borehole. The maximum pCO2 in ice of 0.14 bars is far below the triple point of 5.17 bars and the CO2 vapor saturation line.
References Cited
Bender, M., T. Sowers, and E. Brook. Gases in ice cores. PNAS 94 (16) 8343-834, 1997.
Kuhs, W. F., Klapproth, A., and Chazallon, B.: Chemical physics of air clathrate hydrates, in: T. Hondoh (Ed.), Physics of Ice Cores Records, Hokkaido University Press, Sapporo, 373-392, 2000.
NOAA ESRL Global Monitoring Division - Global Greenhouse Gas Reference Network., 2020. https://www.noaa.gov/jetstream/atmosphere.
Talalay, P., Xiaopeng Fan, Huiwen Xu, Dahui Yu, Lili Han, Junjie Han, Youhong Sun, Drilling fluid technology in ice sheets: Hydrostatic pressure and borehole closure considerations, Cold Regions Science and Technology, Volume 98, 2014, Pages 47-54, ISSN 0165-232X, https://doi.org/10.1016/j.coldregions.2013.10.012.
Talalay, P., Li, Y., Augustin, L., Clow, G. D., Hong, J., Lefebvre, E., Markov, A., Motoyama, H., and Ritz, C.: Geothermal heat flux from measured temperature profiles in deep ice boreholes in Antarctica, The Cryosphere, 14, 4021–4037, https://doi.org/10.5194/tc-14-4021-2020, 2020.
aseh
Chemist modelling engineering processes, Online Instrumentation, Digital twins.
4moGrant Nixon see? the science isn't settled..even ice cores. The comments are just as insightful.
Machine Learning, Hyperspectral Imaging, REE Mineral Exploration Consultant, Real Estate Investor
4moI love phase diagrams especially when you use Schreinemaker's rules to derive them. Don't worry, nobody understands them. 🤣
Married for 52 years, PhD Physics, living off grid
4moVery interesting and informative as always. Thank you.
Metering specialist, project management, entrepreneur
4moNice work documenting what explains the difference between ice core measurements and unlikely disputable proxies such as stomata counts in sediment.