
Drag Coefficients of Irregularly Shaped Particles in Newtonian Fluids


Department of Petroleum Engineering, University of Louisiana at Lafayette, Lafayette, LA 70504, USA
*
Author to whom correspondence should be addressed.
Sustainability 2021, 13(14), 7517; https://doi.org/10.3390/su13147517
Submission received: 31 May 2021
/
Revised: 11 June 2021
/
Accepted: 22 June 2021
/
Published: 6 July 2021
(This article belongs to the Section Sustainable Engineering and Science)
Abstract
:An accurate prediction of the settling velocities of drill cuttings is essential in effectively designing, running, and optimizing drilling operations. If there is no reliable process for modelling the drag coefficient, the settling velocity cannot be obtained. In most current literature, particles are assumed to be spherical, which can be easily modelled. However, this assumption may lead to inaccurate results for other irregular particle shapes. This paper studies the transport behavior of irregular particles by modelling these shapes as variants of a bow shape, with a numerical simulation approach for their drag coefficients. The drilling fluid around the particle is water (Newtonian). The drag coefficients of the non-spherical particle (grouped into three sub-shapes) were modelled. In addition, the inlet velocity of the fluid is varied to show the effects on the shape drag coefficients. The results of the simulations were compared to experimental results carried out by other researchers. It was observed that as the particles became less streamlined, their drag coefficient increased. A sensitivity analysis was carried out to investigate the effects of fluid properties on the drag coefficient. The results were consistent and logical. The results showed that Computational Fluid Dynamics analysis provided a reliable estimation of the drag coefficient, which can help optimize the transport of drill cuttings during drilling operations.
1. Introduction
The effective removal of drill cuttings from a wellbore is indispensable, and the proper hole cleaning ensures the safety of drilling operations. Cuttings are broken bits of rock removed from a borehole, produced by an action of a drill bit during drilling [1]. An understanding of the transport of these drill cuttings is important. Inefficient hole cleaning can cause drilling problems such as circulation loss and drill bit abrasion [2]. However, the transport of these cuttings from the bottom to surface during drilling can be a challenging task due to so many wellbore complexities. These include variations of wall angles, curvature, edge and appendices difference [3].
While it is less complicated to model drill cuttings with a spherical model, it is practically inaccurate to assume that these cuttings are all spherical. To improve the accuracy of cuttings transport models, extra parameters are required [4]. One such parameter is the drag coefficient which varies with the Reynolds number. The drag coefficient of a particle is a dimensionless property defined as the fraction of the kinetic energy of the settling velocity used in overcoming the force of drag on the particle [5]. Many experimental works have investigated the settling of spherical particles [6,7]. The drag coefficient is used to calculate the settling velocity of drill cuttings. This requires a good understanding of the settling behavior of bow-shaped (non-spherical) planner particles, which is the focus of this study. Although there are many empirical correlations for predicting the drag coefficient of non-spherical particles [5,8,9], the models have limitations. One limitation is the number of shapes that a particle can assume. The drag coefficient of non-spherical particles is affected by the particle shapes and settling orientations [10,11,12].
Equation (1) expresses the drag force that opposes the motion of a particle.
where is the drag coefficient; is the fluid density; is the particle settling velocity; and is the particle’s projected cross-sectional area.
In calculating the settling velocity of a particle, it is important to determine the relationship between the drag coefficient and the Reynolds number. The Reynolds number is defined as the ratio of the inertia force to the viscous force as expressed in Equation (2).
where is the viscosity of the fluid and is the Reynolds number.
Equation (3) shows the relationship between the drag coefficient and Reynolds number for a spherical particle [13]:
Many other researchers have proposed empirical relationships between the drag coefficient and the Reynolds number. Examples of such correlations are presented in [14] and [15] expressed by Equations (4) and (5), respectively.
Many factors that can affect the drag coefficient include surface roughness, orientation, Reynolds number, and particle-to-fluid density ratio [16]. There are some existing correlations between the drag coefficient and Reynolds number for nonspherical particles. Equation (6) expresses such a model [6]:
A particle will experience a drag force as a result of the fluid flowing past it in the particle’s direction [17]. This drag force can be computed with a CFD approach. This is suitable for asymmetrical particles.
Numerical simulation is an efficient and effective approach to simulate the transport of particles in a fluid. The shape of a particle plays an important role in its interaction with the surrounding fluid. These particles are commonly modelled as spheres in the current literature [6,14,15,18,19]. Some researchers have investigated the flow around circular cylinder, including the authors of [17,20]. The aspect/axis ratio represents a critical factor in simulating drag in elliptical cylinders [21,22,23] have also worked on establishing the effect this aspect ratio and Reynolds number have on the drag coefficient and streamlined nature of elliptical cylinders. The non-availability of experiments allowed for a comparison of their result with a circular cylinder [21]. The simulation results showed that the drag experienced by elliptic cylinders was less compared to circular cylinders. The results showed that with an axial ratio of 0.6, the drag coefficient of an elliptical cylinder was 40–45% lower than a comparative circular cylinder. Although [4] discussed the CFD modelling of drill cuttings, they studied the transport velocities of spherical and non-spherical particles. Their approach was to simulate the transport velocity with sphericity and not drag coefficient.
The present study will address the inadequacies of previous studies by considering particles as elliptic cylinders. The advantage of this approach over the conventional circular cylinder was that more variations close to drill cuttings were obtained. An understanding and an accurate prediction of the drag coefficient of drill cuttings can help optimize drilling operations. In this study, a numerical solution with ANSYS FLUENT is proposed to investigate the settling of irregular-shaped particles in Newtonian fluid. The effects of the particle shapes on drag coefficient and settling velocity are studied. The results of the study can provide valuable insights into drilling hydraulics optimization for more effective removal of cuttings during drilling operations. This can help rig personnel avoid drilling problems such as stuck pipe and low rate of penetration issues.
2. Model Description
The non-spherical shape considered in this work is an elliptic cylinder. The cylinder is cut into different sections along its longitudinal axis. Figure 1 shows the elliptic cylinder, a half-elliptic cylinder and a lower fraction of the elliptic cylinder.
In this study, irregularly shaped particles were modelled with ANSYS FLUENT. The three shapes given in Figure 1 are simulated to study the impact of the respective shapes on the drag coefficient.
The modelling steps are outlined below.
- Generation of particle geometry;
- Mesh generation and boundary labelling;
- Generation of a fluid domain for simulation;
- Simulation of particle drag coefficient;
- Variation of inlet conditions for different Reynolds numbers.
The fluid flow follows the Navier–Stokes equation. Because the fluid is Newtonian and Equations (7)–(9) express the continuity equation and momentum conservation for a 2D unsteady laminar flow.
Continuity equation:
Momentum equation:
where u and v are the velocities along the x and y directions.
The solid–liquid boundary was discretized by adopting edge sizing reduction and refinement. The inlet, outlet and walls were defined. The boundary conditions were also defined for the inlet and outlet ends as well as the fluid properties. The drag coefficient is calculated with the non-spherical drag law [8], as shown in Equations (10)–(16).
where is the Reynolds number based on the equivalent spherical diameter of the particle.
where is the Shape factor,
where is the surface area of a sphere having the same volume as the particle, is the actual area of the particle.
We define a dimensional particle diameter which shows the relationship between and , it is expressed in Equation (16).
where is the particle density, is the acceleration due to gravity and is the equivalent spherical diameter.
The computational fluid domain for all the particles modelled is shown in Figure 2. The domain’s dimension is 1.5 m by 0.05 m and it contains water as the fluid. Local mesh around the elliptic cylinder is shown in Figure 3.
The same type of mesh was used for the full, half, and lower fraction elliptic cylinders. The K-Epsilon and K-Omega models predict the far and near-wall boundary regions well. However, the SST K-Omega was used in this work. The SST K-Omega model is a combination of K-Epsilon and Standard K-Omega models and is effective for low Reynolds number. It is also useful for high accuracy boundary layer simulation. A 2D representation of the elliptic cylinder is shown in Figure 4, where a and b are the major and minor axes, respectively, and t is height. The full elliptic cylinder represents case A while case B and case C are those of the half and lower fraction elliptic cylinders, respectively.
The hybrid initialization type that uses the Laplace equation and solves for the velocity field was used in this study.
Assumptions
- The fluid is incompressible, which requires the use of the pressure-based solver.
- No-slip wall condition is assumed for the model with the Standard Roughness model being used because of the smooth walls. Velocity at the wall surfaces is zero.
- The effects of interactions between particles are not considered.
- The drilling fluid is Newtonian.
3. Model Results
4. Results
The results of the drag coefficient predicted by the proposed model were compared to results from previous works. Although the model was based on an elliptic cylinder, it was modified to aid easy comparison with models presented in [24] and [17]. The relationship between drag coefficient and inlet velocity for the three study model shapes is also discussed below. This discussion also covers a sensitivity analysis that shows the effect of fluid properties on the drag coefficient. Here, the fluid properties considered are fluid density and viscosity.
Figure 5 compares the drag coefficients predicted by the proposed model and existing models. It is observed there is an inverse relationship between the drag and Reynolds number. In Figure 5 below, it is found that for Reynolds numbers greater than 1000, the drag coefficient is lower than for those less than 1000. The authors of [24] established some experimental result with a cylinder. For validation, the elliptic cylinder in our model is modified to have an aspect ratio of 1:1 (a = b), degenerating it into a circular cylinder. This was done to aid easy comparison with existing literature as they were both circular-based. The simulation result is consistent with the experimental results in [17] and numerical results from literature.
For a Reynolds number between 1 and 10, the simulation results seem to have slightly overpredicted the drag coefficient. As with the results in [24], the drag coefficient maintained approximately a constant value from 1 × 10² to 1 × 10³. The drag coefficient that features a sharp drop in the Reynolds number exists between 1 × 10⁵ and 1 × 10⁶. This current model predicted a near-constant value in this range. The drag coefficient between 1 × 10⁴ and 1 × 10⁷ mirrors the trend found in [17].
Although for Reynolds number greater than 1000, Hoerner’s experimental study produces results of drag coefficient greater than both our model and the numerical model, for Reynolds number between 1–1000 (laminar flow), the results from experimental, numerical and the proposed model show good agreement. This is a notable attribute to consider when designing drilling fluid flow parameters. It is important to consider the drag coefficient associated with the type of flow expected (laminar or turbulent).
Figure 6 compares the relationship between inlet velocity and the drag coefficient for each model shape of the elliptic cylinder. The inlet velocities of the three particle variants considered were varied to observe the effects on the drag coefficient. The results apply to Reynolds number from 50 to 2.0 × 10⁴ and for fluid inlet velocity of 0.025 m/s to 10 m/s, as shown in Figure 6. From the results, it is observed that generally, the drag coefficient is inversely proportional to the inlet velocity. The same trend is observed for the full, half and fractional models. However, for inlet velocity >l m/s, the half model shows the highest drag coefficient compared to the other two models. For inlet velocity <l m/s, the fractional model has the highest drag coefficient, while the elliptic cylinder experiences the least drag. Table 4 presents the values drag coefficient at different Reynolds number for the Validation model.
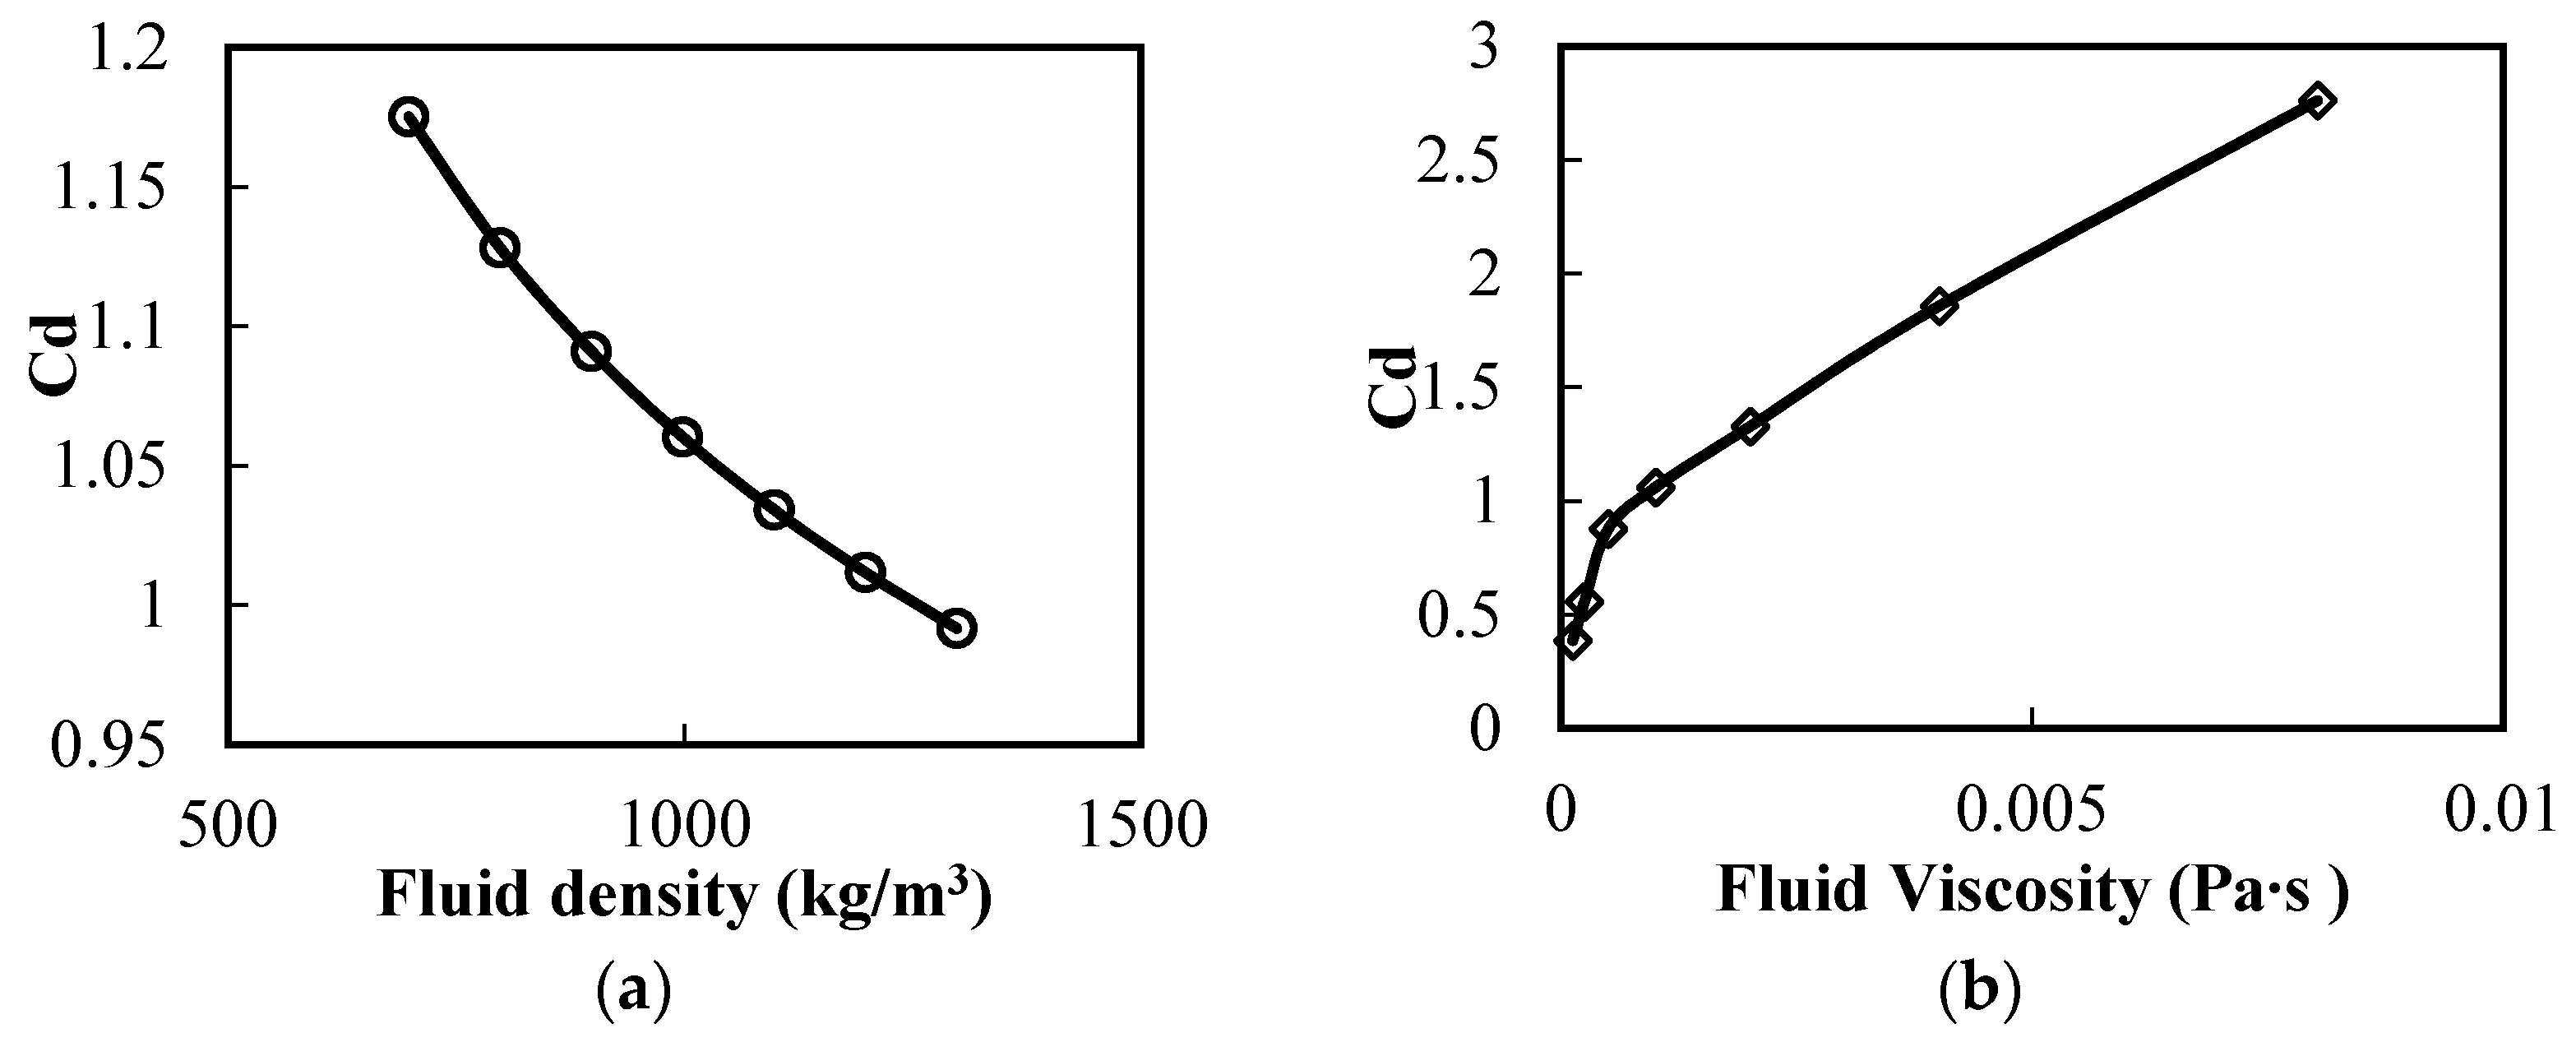
Figure 7 presents the results of the sensitivity analysis performed to study the effect of fluid density (water) and viscosity (water) on the drag coefficient. The fluid viscosity and density were sensitized because, during drilling, they can be modified depending on the drilling conditions. The sensitization also indicated the effect of the drag coefficient on the settling velocity of drill cuttings.
The results from the sensitivity analysis show that the drag coefficient is inversely proportional to the fluid density and directly proportional to the fluid viscosity. Figure 7 shows that the drag coefficient decreases with an increasing fluid density and a decreasing fluid viscosity. However, it is observed that when the fluid viscosity was less than 0.0005 Pa∙s, the drag coefficient has a steeper slope than when the fluid viscosity is greater than 0.0005 Pa∙s. This relationship is significant during the design of drilling fluid. This is to ensure the combination of fluid density and fluid viscosity chosen corresponds to a sufficient drag coefficient, as well as the settling velocity of the drill cuttings.
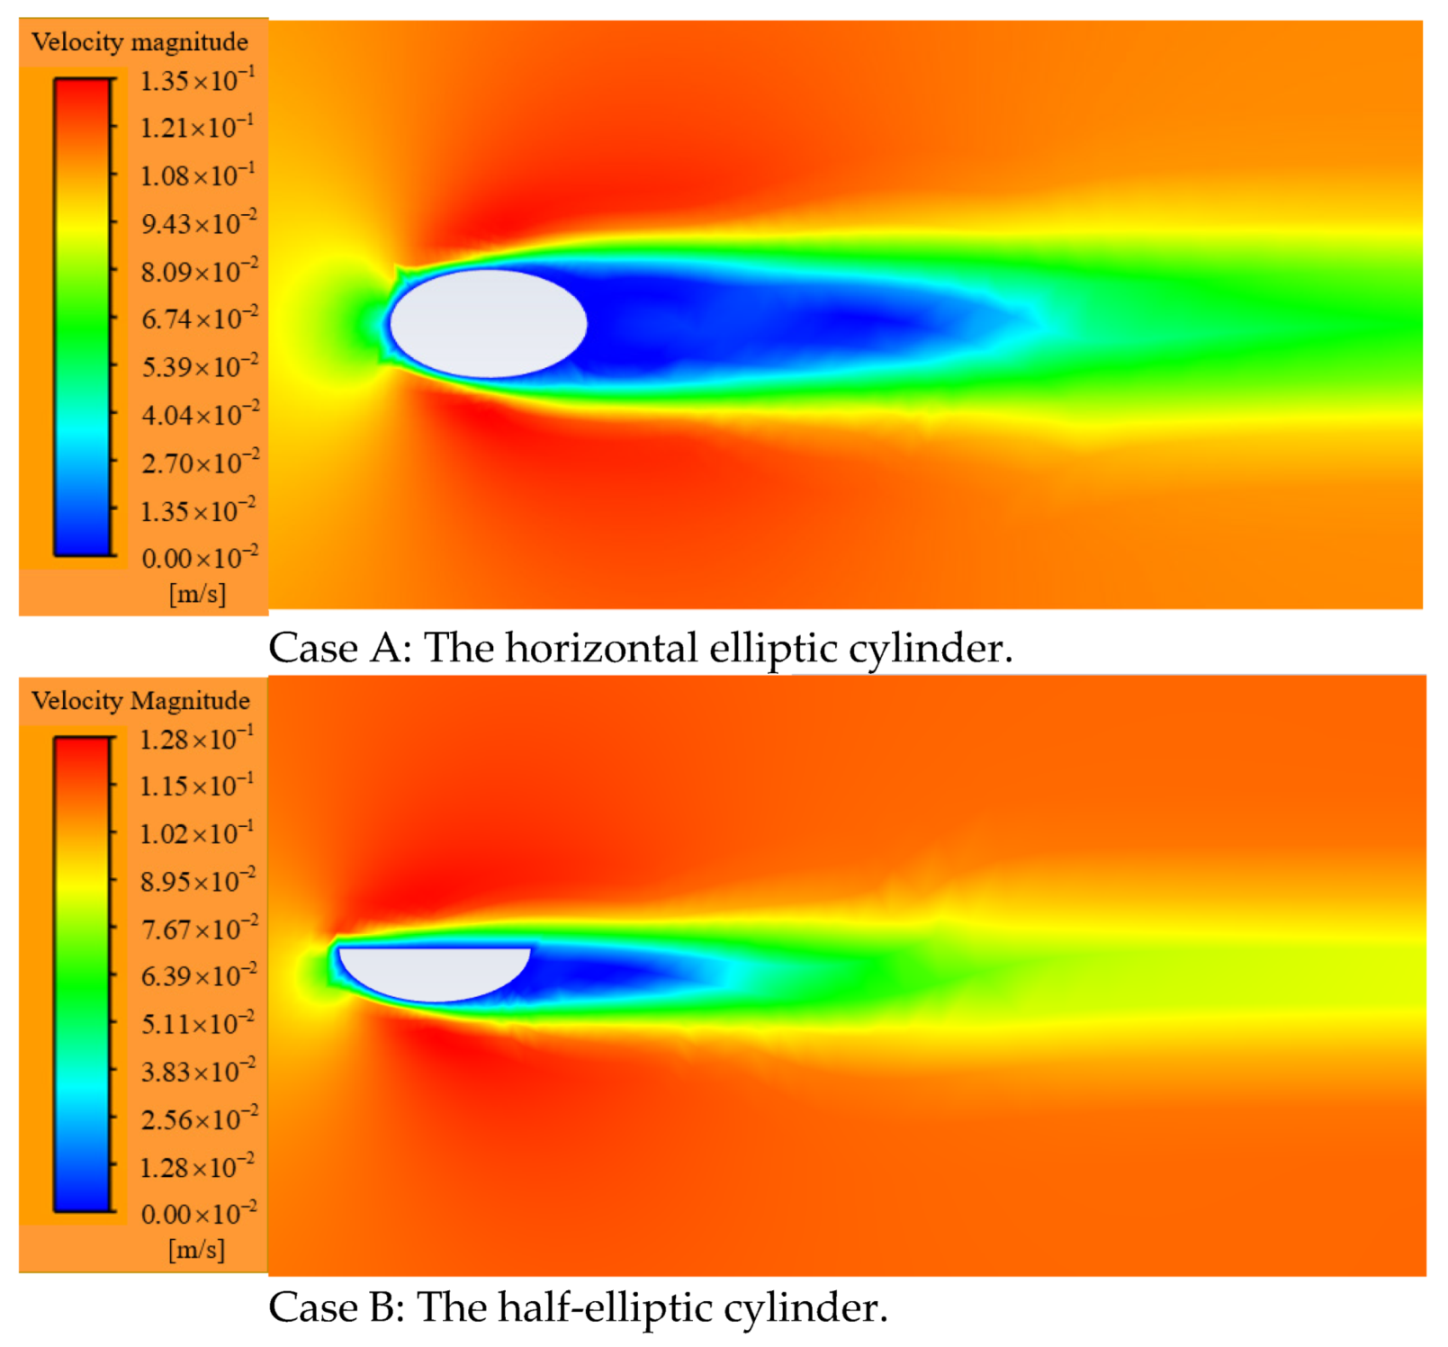
Figure 8 shows the velocity profiles at an inlet velocity of 0.1 m/s for the three particle variants—full, half, and fractional. The results are valid for Reynolds number from 50 to 2.0 × 10⁴ and for fluid inlet velocity 0.025 m/s to 10 m/s.
For Case A, the velocity profile is mainly symmetrical around the particle. It is observed that the drag coefficient has a decreasing linear relationship with the inlet velocity. The inlet velocity varies between 0.025 m/s to 10 m/s.
For Case B, the velocity distribution around the particle tended to be symmetrical for inlet velocity 0.1 m/s. The inlet velocity is also varied as in case A. As the velocity increased, the streamlined part shows a higher velocity field compared to the flat surface. The maximum velocity observed in the field is found to be lower than that of Case A.
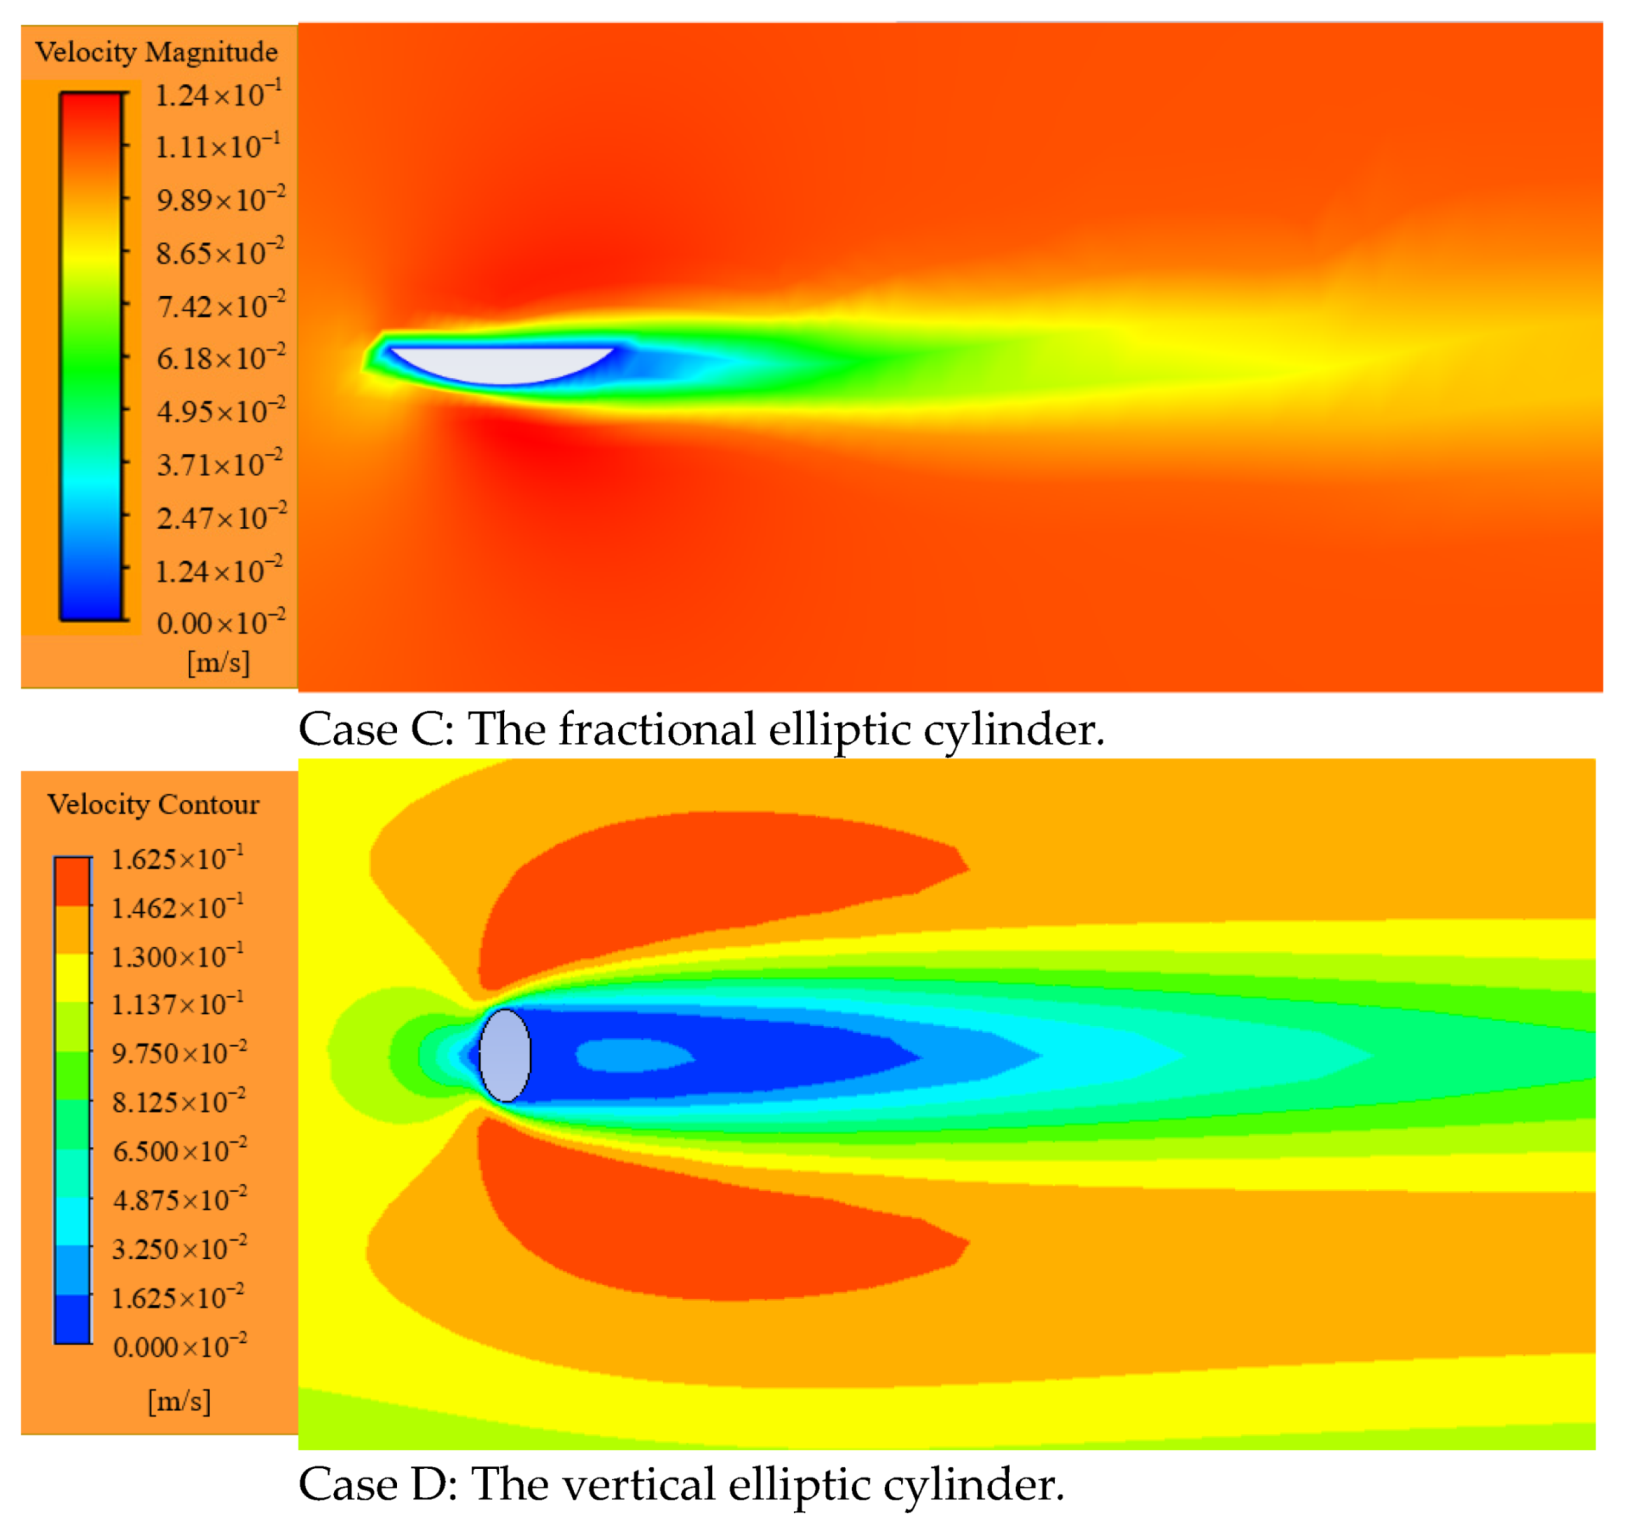
For Case C, the inlet velocity was also varied as in Case A. The streamlined part also displayed a higher velocity field compared to the flat surface. The maximum velocity observed in the field is found to be lower than that of Case A and Case B.
For Case D, the vertical placement shows symmetry as expected with a higher drag compared to the horizontal one.
As the particles generally become less streamlined, the drag coefficient increases as expected. The simulations results are shown below. This includes the drag coefficient and the velocity fields around the particles. It was observed that the higher the inlet velocity of the fluid, the higher the drag coefficient on the elliptic cylinders.
5. The Applicability and Limitations of the Proposed Model
This study proposed a model to calculate the drag coefficient of irregular-shaped plate particles. The particle is suspended and fixed in the fluid, and the drag coefficients are obtained when a Newtonian fluid flows across the particle. It is assumed that fluid–particle interaction dominates the interactions of the particle with external forces and interferences, and the effects of those forces (i.e., gravity) and interferences (interactions from other particles or the wellbore) can be neglected. The model proposed here provides a general assessment of how significant various parameters could affect the transport of drill cuttings, which is expected to shed light on the effective measures that could be taken to improve cutting transport during drilling operations. However, for situations where such external forces or interferences can no longer be ignored, modifications need to be done to consider such forces. For example, for horizontal or inclined wellbores, the interaction between a particle and the wellbore owing to the gravitational force should be considered. The interaction between a particle and the wellbore may require higher drag force from the drilling fluid, which may lead to ineffective hole cleaning if the interaction is not fully considered. Therefore, to prevent the undesired error of estimation from interactions that are not considered, the model provided here can be utilized to provide an initial qualitative drag analysis for vertical wellbores.
A major limitation of the current model is the assumption of the drilling fluid as a Newtonian fluid. The use of a non-Newtonian fluid may provide a more accurate simulation of drilling fluid and a more realistic drag analysis. The effect of the type of drilling fluid will be a subject of future study based on the train of thought outlined in this study.
6. Conclusions
The numerical simulation of the drag coefficient of a 2D elliptic cylinder has been conducted. The simulation considers flow over three variations of the particle shape. The resulting drag coefficient for each variation was analyzed. The performance of this simulation was evaluated by comparing the results with an experimental study and another numerical method. Sensitivity analysis was also performed to identify the important factors affecting the drag coefficient. An investigation was also carried out on the effects of an increasing inlet velocity on the Reynolds number of the particles. The following conclusions are drawn:
- The drag coefficient profile given by our numerical solution is consistent with previous experimental and numerical studies for particles of planner-elliptical shape. However, dimension a was made to be equal to dimension b (a circular equivalent).
- For irregularly shaped particles, the shape of the particle influences the magnitude of the drag coefficient. Numerical simulation shows an increase in drag coefficient as the particle shape became less symmetrical.
- The drag coefficient first decreases with the Reynolds number and then levels off. As fluid velocity and density increase, the drag coefficient drops. As fluid viscosity increases, the drag coefficient increases.
Further work will consider a non-Newtonian fluid with a 3D-modelled ellipsoid. Additionally, the prediction of the drag coefficient of the elliptical particles can be compared.
Author Contributions
Conceptualization, B.G. and O.A.; methodology, O.A.; software, O.A.; validation, O.A., and C.F.; formal analysis, C.F.; writing—original draft preparation, O.A.; writing—review and editing, B.G. and C.F.; supervision, B.G. All authors have read and agreed to the published version of the manuscript.
Funding
This research was supported by the U.S.—Israel Center of Excellence in Energy, Engineering and Water Technology through the project “Safe, sustainable, and resilient development of offshore reservoirs and natural gas upgrading through innovative science and technology: Gulf of Mexico—Mediterranean”.
Institutional Review Board Statement
Not applicable.
Informed Consent Statement
Not applicable.
Data Availability Statement
Not applicable.
Acknowledgments
I would like to appreciate Boyun Guo for the impact he has had on me and for pushing me to get qualitative work done despite the challenges the coronavirus presents to our new world. I am also grateful to the Department of Petroleum Engineering for the continued funding I am getting.
Conflicts of Interest
The authors declare no conflict of interest.
Nomenclature
| fitted constants in Equation (10) | |
| drag force (N) | |
| drag coefficient | |
| particle diameter (m) | |
| equivalent spherical diameter (m) | |
| dimensionless particle diameter | |
| acceleration due to gravity (m/s2) | |
| pressure (Pa) | |
| particle settling velocity (m/s) | |
| Reynolds number | |
| Reynolds number based on the equivalent spherical diameter of the particle | |
| fluid velocity along the y direction (m/s) | |
| particle density (kg/m3) | |
| fluid density (kg/m3) | |
| fluid viscosity (Pa∙s) | |
| shape factor |
References
- Sun, X.; Zhang, K.; Chen, Y.; Li, W.; Qu, J. Study on the settling velocity of drilling cuttings in the power law fluid. Powder Technol. 2020, 362, 278–287. [Google Scholar] [CrossRef]
- Hajipour, M. CFD simulation of turbulent flow of drill cuttings and parametric studies in a horizontal annulus. SN Appl. Sci. 2020, 2, 1–12. [Google Scholar] [CrossRef]
- Baracu, T.; Boşneagu, R. Numerical analysis of the flow around a cylinder for the perspective of correlations of the drag coefficient of the ship’s hulls. Sci. Bull. Nav. Acad. 2019, 22, 256–267. [Google Scholar] [CrossRef]
- Epelle, E.; Gerogiorgis, D.I. CFD modelling and simulation of drill cuttings transport efficiency in annular bends: Effect of particle sphericity. J. Pet. Sci. Eng. 2018, 170, 992–1004. [Google Scholar] [CrossRef] [Green Version]
- Chien, S.-F. Settling Velocity of Irregularly Shaped Particles. SPE Drill. Complet. 1994, 9, 281–289. [Google Scholar] [CrossRef]
- Cheng, N.-S. Comparison of formulas for drag coefficient and settling velocity of spherical particles. Powder Technol. 2009, 189, 395–398. [Google Scholar] [CrossRef]
- Rushd, S.; Hassan, I.; Sultan, R.A.; Kelessidis, V.C.; Rahman, M.; Hasan, H.S.; Hasan, A. Terminal settling velocity of a single sphere in drilling fluid. Part. Sci. Technol. 2018, 37, 943–952. [Google Scholar] [CrossRef]
- Haider, A.; Levenspiel, O. Drag coefficient and terminal velocity of spherical and nonspherical particles. Powder Technol. 1989, 58, 63–70. [Google Scholar] [CrossRef]
- Gabitto, J.; Tsouris, C. Drag coefficient and settling velocity for particles of cylindrical shape. Powder Technol. 2008, 183, 314–322. [Google Scholar] [CrossRef]
- Clift, R.; Grace, J.R.; Weber, M.E. Bubbles, drops, and particles. Dry. Technol. 1978, 11, 263–264. [Google Scholar]
- Mandø, M.; Rosendahl, L. On the motion of non-spherical particles at high Reynolds number. Powder Technol. 2010, 202, 1–13. [Google Scholar] [CrossRef]
- Song, X.; Xu, Z.; Li, G.; Pang, Z.; Zhu, Z. A new model for predicting drag coefficient and settling velocity of spherical and non-spherical particle in Newtonian fluid. Powder Technol. 2017, 321, 242–250. [Google Scholar] [CrossRef]
- George, S.; Stokes, G. On the Effect of the Internal Friction of Fluids on the Motion of Pendulums; Cambridge University Press: Cambridge, UK, 1905; pp. 1–86. [Google Scholar]
- Turton, R.; Levenspiel, O. A short note on the drag correlation for spheres. Powder Technol. 1986, 47, 83–86. [Google Scholar] [CrossRef]
- Brown, P.P.; Lawler, D.F. Sphere Drag and Settling Velocity Revisited. J. Environ. Eng. 2003, 129, 222–231. [Google Scholar] [CrossRef]
- Bagheri, G.; Bonadonna, C. On the drag of freely falling non-spherical particles. Powder Technol. 2016, 301, 526–544. [Google Scholar] [CrossRef] [Green Version]
- Yuce, M.I.; Kareem, D.A. A Numerical Analysis of Fluid Flow Around Circular and Square Cylinders. J. Am. Water Work. Assoc. 2016, 108, E546–E554. [Google Scholar] [CrossRef]
- Rooki, R.; Ardejani, F.D.; Moradzadeh, A.; Kelessidis, V.; Nourozi, M. Prediction of terminal velocity of solid spheres falling through Newtonian and non-Newtonian pseudoplastic power law fluid using artificial neural network. Int. J. Miner. Process. 2012, 110–111, 53–61. [Google Scholar] [CrossRef]
- Barati, R.; Neyshabouri, S.A.A.S.; Ahmadi, G. Development of empirical models with high accuracy for estimation of drag coefficient of flow around a smooth sphere: An evolutionary approach. Powder Technol. 2014, 257, 11–19. [Google Scholar] [CrossRef]
- Son, H.A.; Lee, S.; Lee, J. Numerical Analysis of Drag Force Acting on 2D Cylinder Immersed in Accelerated Flow. Water 2020, 12, 1790. [Google Scholar] [CrossRef]
- Manish, R.; Rajesh, G.; Sarviya, R.M. Numerical Simulation of Flow Around an Elliptical Cylinder at High Reynolds Numbers. Int. J. Fluids Eng. 2013, 5, 29–37. [Google Scholar]
- Li, Z.; Davidson, J.H.; Mantell, S.C. Numerical Simulation of Flow Field and Heat Transfer of Streamlined Cylinders in Cross Flow. J. Heat Transf. 2005, 128, 564–570. [Google Scholar] [CrossRef]
- Mochimaru, Y. Numerical simulation of flow past an elliptical cylinder at moderate and high Reynolds numbers. Contemp. Methods Math. Phys. Gravit. 2015, 1, 1–7. [Google Scholar]
- Hoerner, S. Fluid Dynamic Drag: Practical Information on Aerodynamic Drag and Hydrodynamic Resistance; Hoerner Fluid Dynamics: Bakersfield, CA, USA, 1965. [Google Scholar]
Figure 1.
(a) Right: an elliptic cylinder. Left: a half-elliptic cylinder. (b) A fraction of the elliptic cylinder.
Figure 1.
(a) Right: an elliptic cylinder. Left: a half-elliptic cylinder. (b) A fraction of the elliptic cylinder.

Figure 2.
Schematic view of computational domain showing the particle.

Figure 3.
Meshing around the elliptic cylinder.

Figure 4.
A 2D representation of the ellipse making up the elliptic cylinder.

Figure 5.
Drag coefficient as a function of Reynolds number.

Figure 6.
Plots for the drag coefficient against the inlet velocity for the full, half and fractional elliptic cylinders.
Figure 6.
Plots for the drag coefficient against the inlet velocity for the full, half and fractional elliptic cylinders.

Figure 7.
(a) Drag coefficient vs. fluid density for full elliptic cylinder. (b) Drag coefficient vs. fluid viscosity for full elliptic cylinder.
Figure 7.
(a) Drag coefficient vs. fluid density for full elliptic cylinder. (b) Drag coefficient vs. fluid viscosity for full elliptic cylinder.

Figure 8.
Velocity profiles at 0.1 m/s for the three variant shapes of non-spherical particle.


Table 1.
Dimension of Numerical Model.
| Geometrical Parameter | Magnitude (m) |
|---|---|
| Major axis, a | 0.002 |
| Minor axis, b | 0.001 |
| Height, t | 0.0005 |
Table 2.
Boundary Conditions.
| Conditions | |
|---|---|
| Inlet Boundary | |
| Viscosity ratio | 10% |
| Fluid inlet velocities | 0.1 m/s, 0.5 m/s, 1.0 m/s |
| Initial gauge pressure | 0 Pa |
| Velocity specification method | Magnitude, Normal to Boundary |
| Outlet boundary | |
| Viscosity ratio | 10% |
| Pressure | 0 Pa |
| Backflow pressure specification | Total pressure |
| Wall | |
| Roughness model | Standard |
| Road | No-slip |
Table 3.
Other Simulation Parameters.
| Parameters | |
|---|---|
| Density of water | 997 kg/m3 |
| Viscosity of water | 0.001 Pa∙s |
| Turbulence model | K-Omega (2-equation) |
| Solver type | Pressure based |
| Solution method | Pressure velocity coupling, 2nd order upwind iterations |
| Solution initialization type | Hybrid |
Table 4.
Flow Conditions Used for the Simulation.
| Case | Inlet Velocity | Cd | |
|---|---|---|---|
| 1 | 0.001 | 2 | 12.195 |
| 2 | 0.002 | 4 | 8.015 |
| 3 | 0.008 | 15 | 3.688 |
| 4 | 0.019 | 38 | 2.209 |
| 5 | 0.080 | 160 | 1.404 |
| 6 | 0.095 | 190 | 1.354 |
| 7 | 0.126 | 250 | 1.267 |
| 8 | 0.146 | 290 | 1.216 |
| 9 | 0.502 | 1000 | 0.729 |
| 10 | 5.024 | 10,000 | 0.587 |
| 11 | 50.240 | 100,000 | 0.526 |
| 12 | 125.601 | 250,000 | 0.516 |
| 13 | 502.404 | 1,000,000 | 0.505 |
| 14 | 753.606 | 1,500,000 | 0.502 |
| 15 | 1004.809 | 2,000,000 | 0.501 |
| 16 | 2009.617 | 4,000,000 | 0.498 |
Publisher’s Note: MDPI stays neutral with regard to jurisdictional claims in published maps and institutional affiliations. |
© 2021 by the authors. Licensee MDPI, Basel, Switzerland. This article is an open access article distributed under the terms and conditions of the Creative Commons Attribution (CC BY) license (https://creativecommons.org/licenses/by/4.0/).
Share and Cite
MDPI and ACS Style
Akanni, O.; Fu, C.; Guo, B. Drag Coefficients of Irregularly Shaped Particles in Newtonian Fluids. Sustainability 2021, 13, 7517. https://doi.org/10.3390/su13147517
AMA Style
Akanni O, Fu C, Guo B. Drag Coefficients of Irregularly Shaped Particles in Newtonian Fluids. Sustainability. 2021; 13(14):7517. https://doi.org/10.3390/su13147517
Chicago/Turabian StyleAkanni, Owolabi, Chunkai Fu, and Boyun Guo. 2021. "Drag Coefficients of Irregularly Shaped Particles in Newtonian Fluids" Sustainability 13, no. 14: 7517. https://doi.org/10.3390/su13147517
Note that from the first issue of 2016, this journal uses article numbers instead of page numbers. See further details here.