
Breast Cancer Survival Analysis Model
by
Rong-Ho Lin
1, 
Ching-Shun Lin
1,*,
Chun-Ling Chuang
2,
Benjamin Kofi Kujabi
1 and
Yen-Chen Chen
1 1
Department of Industrial Engineering and Management, National Taipei University of Technology, Taipei 10608, Taiwan
2
Department of Information Management, Kainan University, Taoyuan City 33857, Taiwan
*
Author to whom correspondence should be addressed.
Appl. Sci. 2022, 12(4), 1971; https://doi.org/10.3390/app12041971
Submission received: 5 January 2022
/
Revised: 7 February 2022
/
Accepted: 10 February 2022
/
Published: 14 February 2022
(This article belongs to the Section Applied Biosciences and Bioengineering)
Abstract
:(1) Background: Breast cancer (BC)—a leading cause of mortality in women globally—accounts for more than two million cases annually. BC was the most common cancer in Taiwan in 2015 and ranks among the top 10 malignancies in Taiwan. (2) Methods: We established a collection of BC survival and metastasis analyses using the Kaplan–Meier, logarithmic test, and Cox proportional hazard models to investigate the association among BC stages, different treatment modalities, and survival rate of patients with BC at various follow-up intervals. We also evaluated whether clinical prognostic factors had univariate and multivariate effects on the survival of patients with BC. Finally, we performed a metastasis analysis using the survival transition rate values of BC stages to develop a Markov chain and semi-Markov simulation model for BC and BC metastasis analysis, respectively. (3) Results: The Kaplan–Meier survival analysis revealed that the risk of BC treated with surgery was lower than that of those who did not receive surgery and the recommended treatment methods should be ranked by survival as follows: surgery, hormone therapy, chemotherapy, and radiation therapy (in descending order of risk). This is attributed to the predicted survival rate which ranges from 99.6% to 91.2%. Moreover, Cox’s treatment method considered the patient’s attributes and revealed a significant difference (p = 0.001). The Markov chain analyses determined the chance of metastasis at each stage, indicating that the lower the stage of BC, the greater the survival rate. (4) Conclusions: Patients’ treatment is influenced by different BC stages, and earlier detection presents better chances of survival and a greater probability of treatment success.
1. Introduction
Breast cancer (BC) is one of the most prevalent malignancies in women worldwide. BC affects over two million women each year, with significant mortality rates in both developing and developed nations. BC has surpassed lung cancer as the primary cause of cancer mortality in women (accounting for 15% of all cancer fatalities). The yearly incidence of BC in all countries has been increasing yearly, and what was once a priority in Western countries has become a global issue [1]. Due to numerous factors, such as the consumption of dietary fat, solvent and pesticide exposure have been regarded as potential risk factors for breast cancer. However, the evidence for this is still unconvincing thus far [2]. According to the National Health Agency’s cancer registration data, BC was the most common cancer among women in Taiwan in 2017. There were 14,801 patients with BC (per 100,000 population), with a crude incidence rate of 125.64 and an age-standardized incidence rate of 87.54. BC was shown to be more common in females than in males, placing first among the top 10 cancers. Since the patient population for each malignancy differs, age standardization is employed to reduce the disparity in population makeup. As a result, age may be objectively compared on the same basis. Furthermore, an analysis of data from 2010 to 2014 reveals that the overall five-year survival rate of BC in Taiwan is more than 90%, as is the five-year survival rate of each stage. It has been shown that the higher the stage of BC, the lesser the chance of survival. As a result, if BC is identified early, not only may breast preservation surgery be performed but the five-year survival rate can exceed 90% [3]. However, tumor size, nodal status, and expression of ER, PR, and human epidermal growth factor receptor-2 play a role in the therapy of early-stage BC (HER2) [4].
To ascertain the survival rate of BC, Ali-Gombe et al., 2021 [5] used Kaplan–Meier survival analysis to determine the survival time of patients with BC, and they also used Cox’s proportional hazard model and log-rank test in their research. In another advancement, Bsrat Tesfay [6] discovered the factors influencing the time to death among patients with BC in his study using the Kaplan–Meier survival curve with the log-rank test to assess survival among predictor variables. The net effect of each independent variable was then calculated using Cox regression. Despite this, significant progress has been achieved in analyzing the survival of patients with BC and BC stages utilizing the aforementioned statistical methods. As a result, early detection of BC demands a precise and trustworthy procedure that allows clinicians to differentiate between benign and malignant tumors [7].
However, principles and methods related to the evaluation of prognostic factors are not well established due to the fact that assessment of the prognostic factors has been confounded by treatment [8].
The goal of this study is to establish a collection of BC survival and metastasis analyses. First, the Kaplan–Meier [9], logarithmic test, and Cox proportional hazard models [10] were used to investigate the link between BC stages, different treatment modalities, and the survival rate of patients with BC at various follow-up intervals. Second, we evaluated whether clinical prognostic factors had univariate and multivariate effects on the survival of patients with BC. Finally, we performed a metastasis analysis utilizing the survival transition rate values of BC stages to develop a Markov chain model for BC and a semi-Markov simulation model for BC metastasis analysis, respectively, to establish an objective reference standard for treatment results and provide information to physicians to aid in diagnosis.
2. Materials and Methods
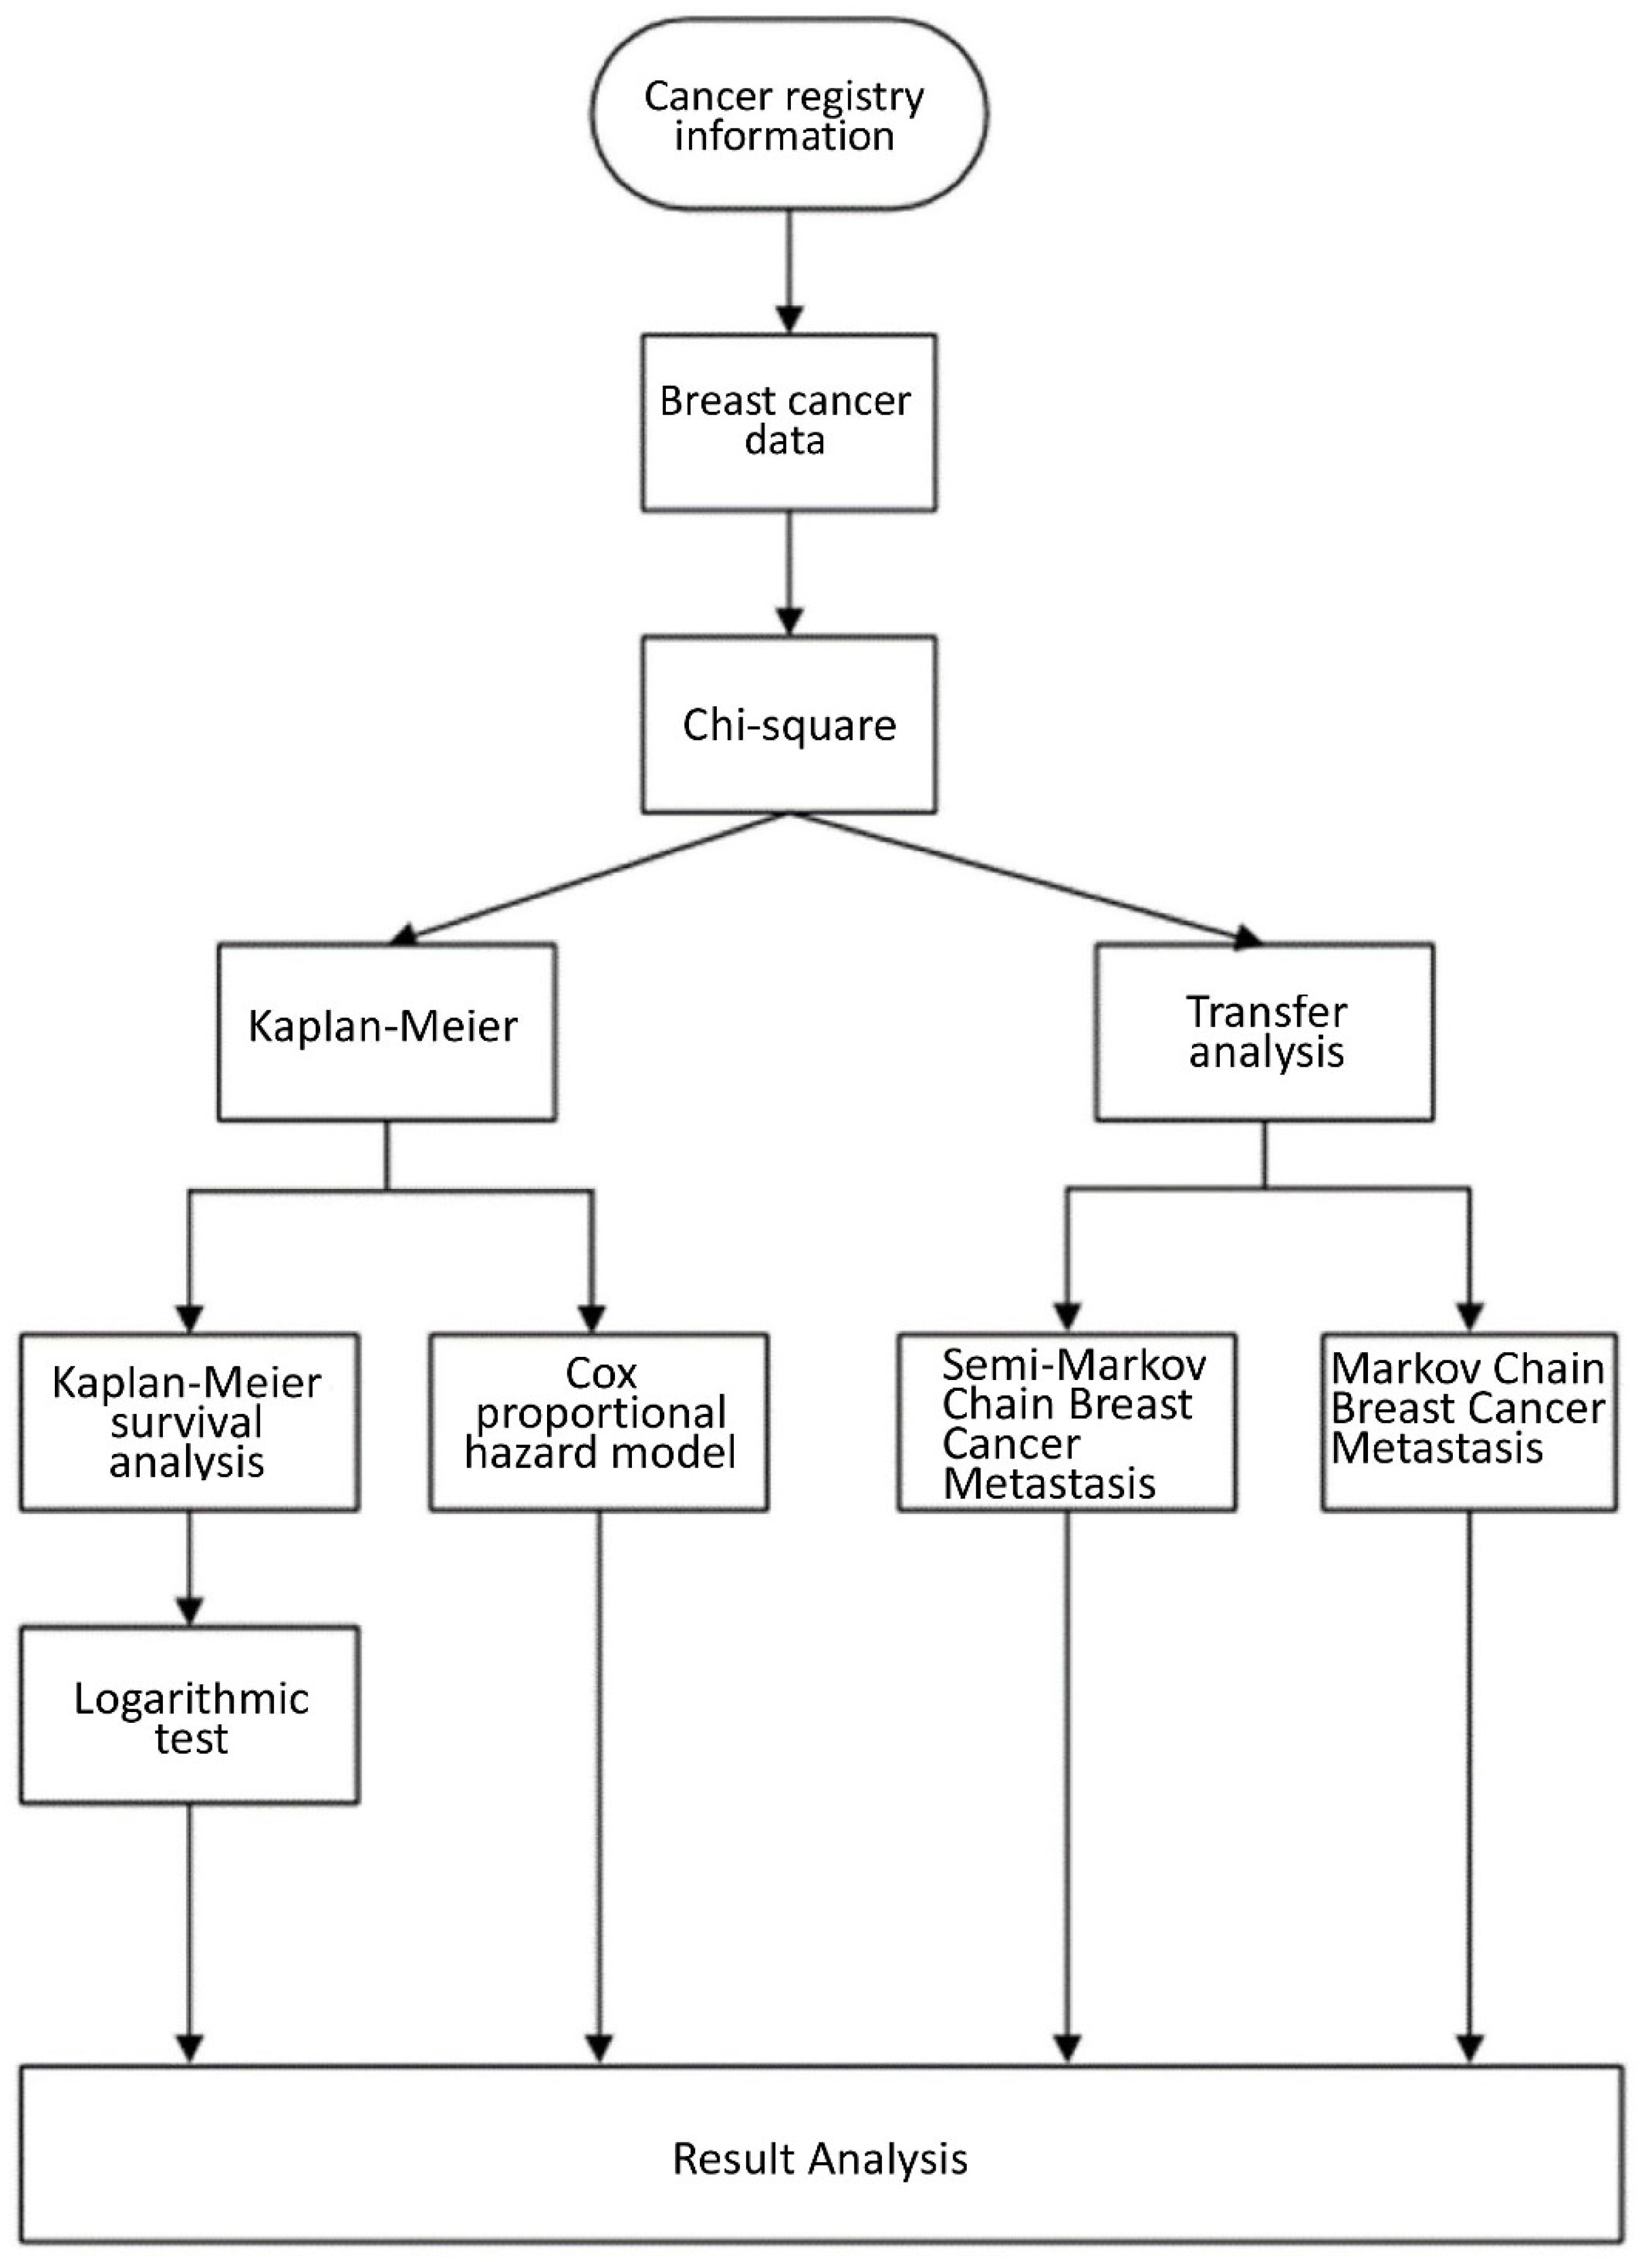
The auxiliary BC survival analysis model was constructed as shown in Figure 1. Briefly, we first analyzed the original data of the BC registry in a hospital in northern Taiwan during 2005–2010 and then screened the patients with BC for gender, age, and treatment methods. We then performed a chi-square analysis to determine the correlation between the variables and their survival status [11]. We also employed the Kaplan–Meier univariate survival analysis to investigate the survival time of patients with BC and used the logarithmic test to determine whether it was significant. Finally, the Cox proportional risk model was applied to analyze the predictive factors affecting the survival time, patient characteristics, treatment method, and surgery. The Markov chain model of metastasis was used to calculate the probability of BC reaching a stable state in the patients.
2.1. Breast Cancer Data
The data source of this study was obtained from the BC registry data of Northern District Hospitals in Taiwan collected from 2005 to 2010 with a total of 2089 cases. 6 (0.3%) men and 2083 (99.7%) women. The mean age of the study sample was 52.98 years (standard deviation: 11.245 years and median: 52.00 years).
There were 6 (0.3%) males, 2083 (99.7%) females, 340 (16.3%) carcinomas in situ, 1749 (83.7%) invasive carcinomas; 257 (12.3%) well differentiated, and 844 (40.4%) moderately differentiated, 775 (37.1%) patients with poor differentiation, unknown 213 (10.2%); 315 (15.1%) patients with clinical judgment at stage 0, 464 (22.2%) patients with stage 1, 371 (17.8%) patients with stage 1A, and stage 2A 640 (30.6%), 2B patients accounted for 160 (7.7%), 64 (3.1%) patients with stage 3A, 26 (1.2%) patients with stage 3B, 13 (1.6%) patients with stage 3C. 36 (1.7%) patients with 4th stage; 52 (2.5%) patients without surgical treatment; 2037 (97.5%) patients with surgical treatment; 1040 (49.8%) patients without radiotherapy, and 1027 (49.2%) patients with radiotherapy; 908 (43.5%) patients without chemotherapy, 1179 (56.4%) patients with chemotherapy and 2 (0.1%) unknown; 578 (27.7%) patients without hormone therapy, 1506 (72.1%) patients with hormone therapy, unknown 5 (0.2%); 2036 (97.5%) patients survived and 53 (2.5%) died as depicted in Table 1.
2.2. Chi-Square Test
We analyzed the patient’s survival time, gender, treatment method, and other variables to further understand the characteristics of the sample. A Chi-square test was applied to investigate the existence of a significant relationship between the survival time and the variables such as gender and treatment method (the correlation coefficient between the two was zero), with p < 0.05 indicating a statistically significant relationship.
2.3. Kaplan–Meier Survival Analysis
Kaplan–Meier survival analysis considers the survival rate at each point in time, and this is displayed simultaneously in a step-shaped function graph. Categorical variables such as gender, treatment, and age were used to calculate the cumulative survival rate and then plot the survival curve separately, followed by comparing the survival rate of patients with BC who received surgery with those who did not [12].
2.4. Logarithmic Test
We first created the survival curve using the Kaplan–Meier method to understand the distribution of survival curves between different treatment modalities and then explored the existence of significant differences in the survival curves between different treatment modalities (p < 0.05). Sufficient evidence was accumulated to overturn the null hypothesis, indicating that the two survival curves were significantly different.
2.5. Cox Proportional Risk Model
We first used the Cox proportional risk model to determine whether the variables showed significant differences with respect to the prediction of survival time and risk and then explored the impact of treatment methods (such as surgical treatment, radiotherapy, and chemotherapy) on the patients’ survival. The survival analysis and risk assessment ratio of the multivariate Cox proportional risk model test was performed with or without surgical treatment, considering the pathological stage, diagnosis age, sexual status code, grade differentiation, estrogen hormone receptor test, and progesterone hormone receptor test, at (p < 0.05), indicating statistical significance.
2.6. Markov Chain BC Metastasis Model
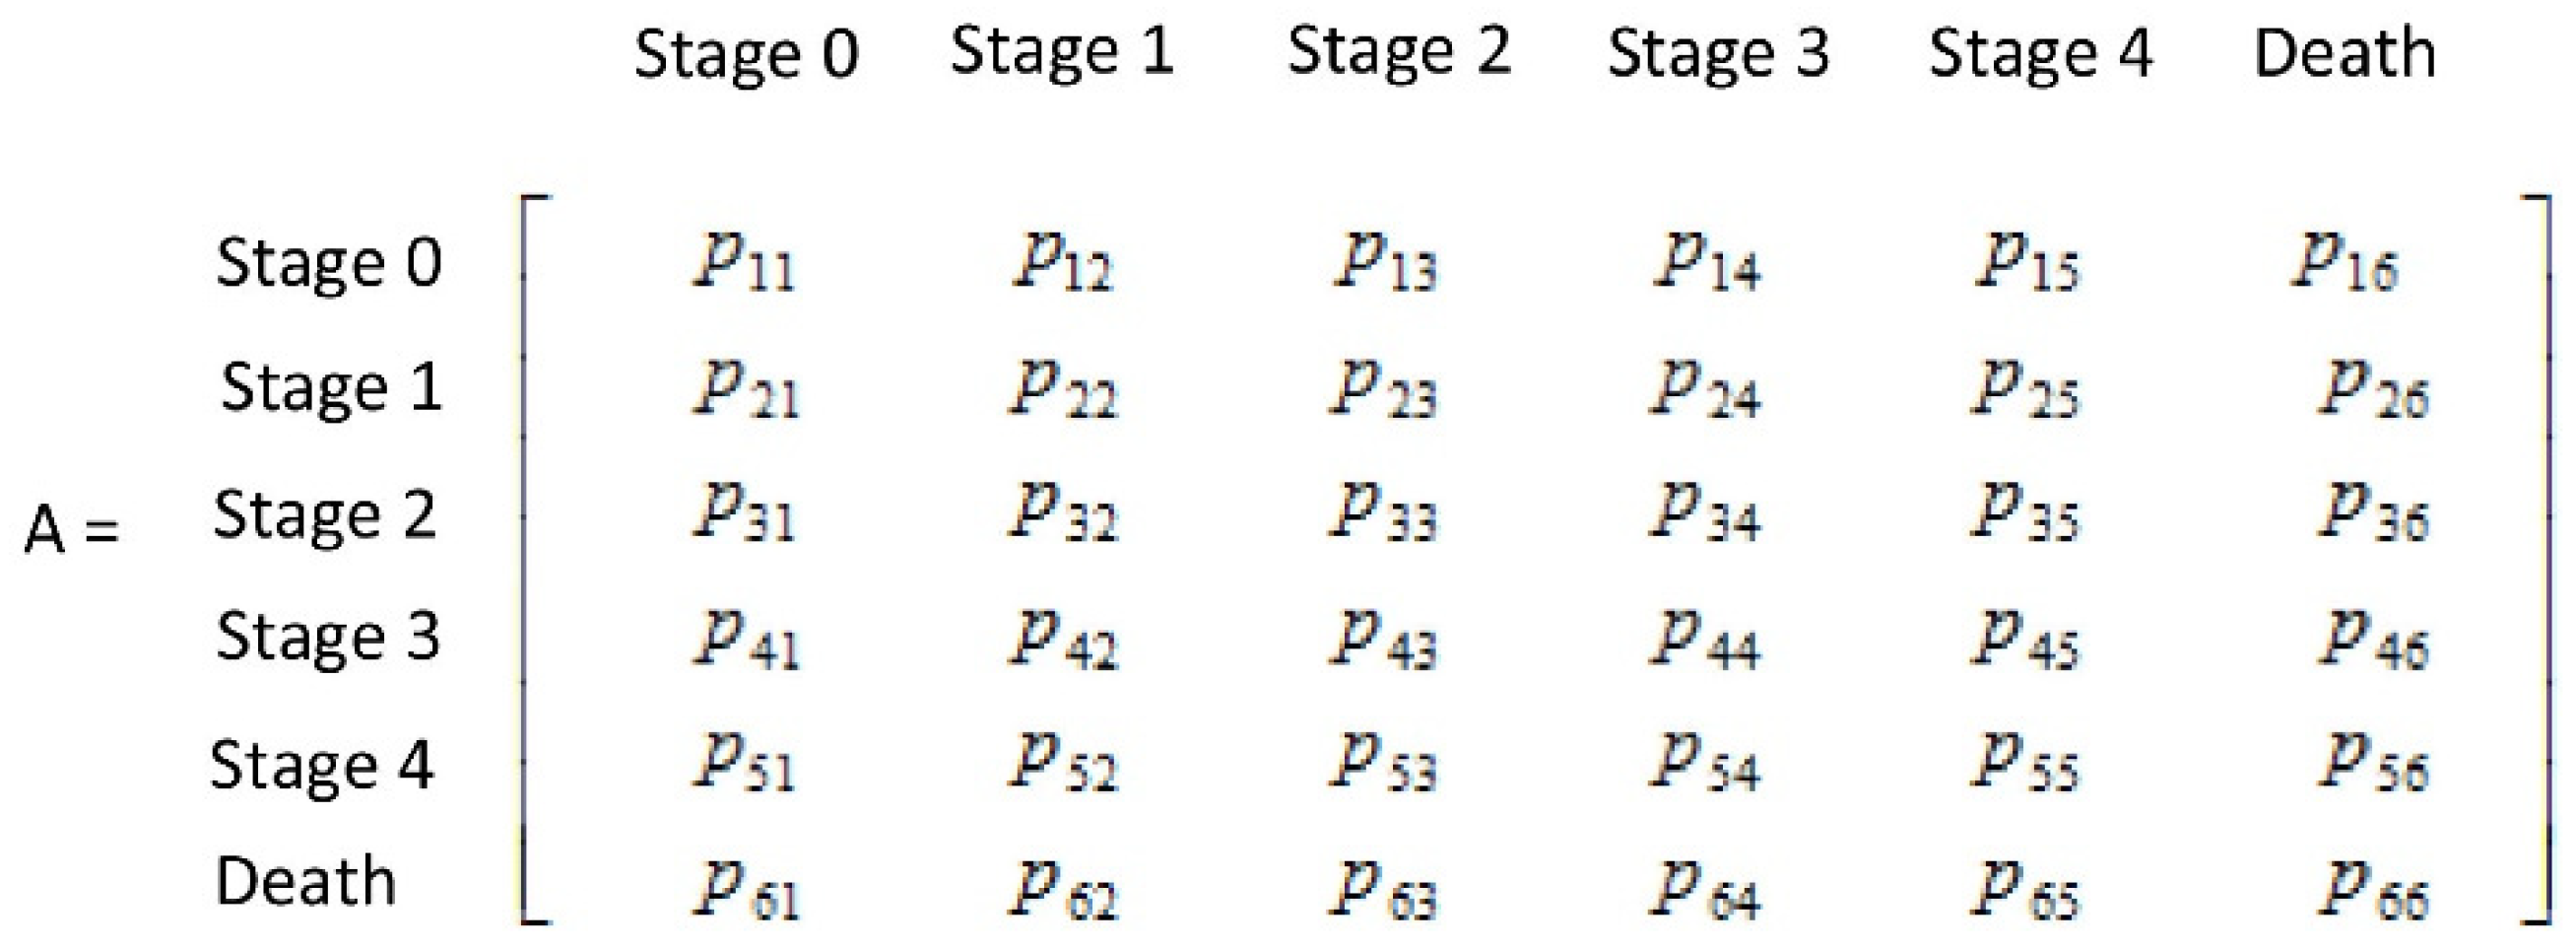
In this study, the breast cancer status was classified into six stages: stage 0, stage 1, stage 2, stage 3, stage 4, and death. Therefore, we applied a 6 x 6 Markov matrix.
The Markov matrix Pij indicates that the previous measurement of the health is the status i, and the current measurement of the health index j is the probability value of the changing status. The type of Markov matrix generated based on this concept is depicted in Figure 2 and Equation (1).
where nij indicates the number of people whose clinical stage i is converted to the pathological stage j. pij indicates that the clinical stage i is a condition, and the pathological stage j is converted to a condition with a probability of occurrence. M indicates the population and Ni the total number of people.
Based on Equation (1) and the properties of Markov matrix, the transition of each condition can be calculated in the long-term using Equation (2).
n is the number of intervals, A is the metastasis probability matrix, X is the Markovian metastasis matrix of the stages of breast cancer in the first year, and Y is the distribution vector of breast cancer stages after n stages. According to the nature of Markov’s probability transfer matrix, the multiplication of multiple probability transfer matrices will tend to become more and more stable.
Therefore, in this study, n Markovian odds ratio matrices were multiplied together. The final table Markovian odds ratio matrix Y was calculated over a long period, and the population size of each final BC stage could be deduced from the odds ratio values in each column of the matrix Y.
2.7. Half-Markov Chain
This section presents the detailed procedure of the multistate semiMarkov model used in this study. The semiMarkov model process was mainly sourced from the model developed by Listwoń and Saint-Pierre (2013) [13], which is a “semiMarkov” software package for R software 4.0.5 (Lucent Technologies, Murray Hill, NJ, USA) (https://www.r-project.org/). There are two goals involved in this process: the first goal is the calculation of the probability of each transition between the Markov state and, on the other hand, the influence of the covariate on the transition. The semiMarkov model’s basic feature was to dissect the problem into several different stages to study the phenomenon between state transitions and evaluate metastasis events of BC by dividing the patient’s health status into four different stages. These stages consisted of BC stages I–IV. The treatment method for each patient was considered as a set of covariates, including surgery, radiotherapy, chemotherapy, and hormonal therapy. All covariates were expressed as binary parameters, with a code of 0 for the control group and 1 for the treatment group.
3. Results
This study calculated the underlying metastasis rates and investigated the effect of several covariates on the risk of state metastasis. The conversion rates of the simulated inputs were not considered to include any covariates representative of the general condition of patients with metastasis, and the time conversion probability was derived according to the formula in the semi-Markov process. The waiting time distribution of patients in the database was calculated based on the Weibull distribution and, according to Foucher (2005) [14], three models were employed to analyze the effect of covariates on the risk of transition between stages, namely, the basic, univariate, and multivariable models.
- 1
- Basic Model: the basic model does not contain any covariates. Its main purpose was to generate time-dependent risk rates between stages based on the database data that were to be used as transition rates from one state to another in the simulation model. Four univariate models were developed for each covariate (i.e., surgical treatment, radiotherapy, chemotherapy, and hormonal treatment). Each conversion was checked using Wald (H0: βij = 0; H1: βij ≠ 0) [15]. We then evaluated whether all of the significant covariate parameters (p < 0.05) from each univariate model were significant and selected the significant model from multiple univariate models and merge them into a multivariate model.
- 2
- Multivariate model: all significant covariates selected in the previous step were included in a multivariate model. Therefore, the covariate vector is specific to the transformation to pass the Wald test H0: βij = 0; H1: βij ≠ 0). Examining each covariate parameter, the parameter (p < 0.05) was considered to be a noteworthy factor that significantly affected the particular transformation.
3.1. Case Description
3.1.1. Kaplan–Meier Survival Analysis
Diagnosis Age
According to the Kaplan–Meier survival analysis for BC, the age of diagnosis was 84.13 ± 0.916 and 85.491 ± 0.420 months for patients >45 years and <45 years, respectively. The survival analysis of BC at the age of diagnosis indicated no significant difference in the number of months of survival at the age of diagnosis, whereas the log-rank test = 0.148 (>0.05) indicated no statistically significant difference between the age of diagnosis and survival time.
BC Morphology
The Kaplan-Meier survival analysis for breast cancer morphology was 84.697 ± 0.303 months for carcinoma in situ cancer and the mean survival months for invasive carcinoma was 84.672 ± 0.458. Although the survival analysis of breast cancer morphology showed that there was no significant difference in the number of months, the log-rank test = 0.004 (<0.05) indicated that there was a statistically significant difference in the survival time.
Graded Differentiation of BC
The Kaplan–Meier survival analysis for BC graded differentiation had a mean survival of 86.194 ± 0.793, 83.598 ± 585, and 82.203 ± 0.731 months for well-differentiated, moderately differentiated, and poorly differentiated, respectively. As shown in the graph, there was a significant difference in the number of months of survival for BC by the grade of differentiation, and the log-rank test = 0.032 (<0.05) indicated that there was a statistically significant difference in the survival time by the grade of differentiation.
Surgical Treatment
Survival analysis of surgical treatment for BC was 73.83 ± 3.37 and 85.30 ± 0.38 months without and with surgery, respectively. Survival analysis of the surgical treatment of BC indicated a significant difference in the number of months of survival with or without surgical treatment of BC, whereas the log-rank test = 0.017 (<0.05) indicated a statistically significant difference in the survival time with or without surgical treatment of BC.
Radiation Therapy
Survival analysis of radiation therapy for BC was 85.45 ± 0.55 and 84.86 ± 0.57 months without and with radiation therapy, respectively. Survival analysis of BC radiation therapy indicated no significant difference in the number of months of survival with or without BC radiation therapy, whereas the log-rank test for radiation therapy = 0.365 (>0.05) indicated no statistically significant difference in the survival time with or without BC radiation therapy.
Chemotherapy
Survival analysis of chemotherapy for BC was 85.03 ± 0.35 and 83.88 ± 0.60 months without and with chemotherapy, respectively. A significant difference was detected in the number of months survived with or without chemotherapy for BC, while the log-rank test for chemotherapy = 0.000 (<0.05) indicated a statistically significant difference in survival time with or without chemotherapy for BC.
Hormone Therapy
Survival analysis of hormonal treatment for BC was 80.57 ±1.24 months without hormonal treatment and 86.62 ± 0.32 months with hormonal treatment. Survival analysis of hormone therapy for BC indicated no significant difference in the number of months of survival with or without hormone therapy for BC, whereas the log-rank test = 0.000 (<0.05) for hormone therapy indicated a statistically significant difference in survival time with or without hormone therapy for BC.
Estrogen Hormone Receptor Test
Table 2 and Figure 3 demonstrate the Kaplan–Meier survival analysis of the BC estrogen hormone receptor test. The average survival months in the (−) negative group were 82.512 ± 0.951 months, the average survival months in the (+) low positive group were 85.463 ± 0.759 months, and the average survival months in the (+) medium positive group were 84.532 ± 0.533 months. The average survival months for (+) high positives were 86.703 ± 0.432 months, whereas 80.00 ± 0.806 months for (+) were positive unknowns. The survival analysis of the estrogen receptor test (ERA) for BC reveals a significant difference in the number of months of survival of the ERA for BC, and the log-rank test p = 0.001 (<0.05) for ERA reveals a statistically significant difference in the ERA survival time.
Progesterone Receptor Test
Table 3 and Figure 4 demonstrate the Kaplan–Meier survival analysis of the BC progesterone receptor test (PRA). The average survival months in the (−) negative group were 82.606 ± 1.075 months, the average survival months in the (+) low positive group were 85.280 ± 0.795 months, and the average survival months in the (+) medium positive group were 83.186 ± 0.757 months. The average survival months for (+) high positives were 86.690 ± 0.491 months, whereas 81.000 ± 1.915 months for (+) were positive unknowns. Survival analysis of the PRA for BC reveals a significant difference in the number of months of survival, and the log-rank test = 0.003 (<0.05) for PRA reveals a statistically significant difference in the duration of survival of PRA.
3.1.2. Cox Proportional Hazard Model
Cox analysis of Surgical Treatment
This test employs IBM SPSS Modeler 22.0 [16] as the test software to investigate the effect of treatment methods (surgery, radiotherapy, and chemotherapy) on patients’ survival, as well as to perform a multivariate Cox proportional risk model-checked survival analysis and hazard ratio assessment in the absence of surgical treatment.
A multivariate Cox proportional risk model test with and without surgery was performed, taking into account pathological stage, age at diagnosis, sex code, graded differentiation, estrogen hormone receptor test, and progesterone receptor test. As shown in Table 4, the survival rate of the surgical treatment group was significant (p = 0.004 < 0.05), indicating that surgical treatment had an effect on the survival rate of patients with BC, and the relative risk HR = 1.650, indicates that the risk of death with or without surgical treatment was 1.650 higher than that of surgical treatment (Figure 5). It can be observed that when all factors are included, the patients who underwent surgical treatment had a better chance to survive than patients who had not performed surgery.
Cox Analysis of Radiotherapy
To explore the impact of radiotherapy on the survival of patients with BC, a multivariable Cox proportional hazard model test was performed with and without radiotherapy, taking into account the pathological stage, diagnosis age, gender, stage differentiation, and estrogen hormone receptor test and PRA revealed that the survival rate of the group with radiotherapy, as shown in Table 4, is highly significant (=0.002 < 0.05), indicating that radiotherapy has an impact on the survival rate of patients with BC, and the relative risk HR = 1.155, which means that the risk of death without radiotherapy is 1.155 times high than with radiotherapy. Figure 6 indicates that when all factors are included, the survival rate with radiation is higher than that without treatment.
Cox Analysis of Chemotherapy
A multivariate Cox proportional risk model-validated survival analysis and risk ratio assessment were performed without chemotherapy to investigate the effect of chemotherapy on patient survival, taking into account pathological stage, age at diagnosis, gender, grade differentiation, estrogen hormone receptor test, progesterone hormone receptor test. As indicated in Table 4, the results were found to be significant (p = 0.000 < 0.05), suggesting that chemotherapy has an impact on the survival of patients with BC, and the relative risk HR = 1.415, indicating that the risk of death without chemotherapy is 1.415 times higher than that with chemotherapy. Figure 7 demonstrates that when all factors are included, the survival rate with chemotherapy is higher than that without chemotherapy.
Cox Analysis of Hormone Therapy
The multivariable Cox proportional hazard model test survival analysis and hazard ratio assessment were performed with and without hormone therapy, taking into account the pathological stage, diagnosis age at diagnosis, gender, stage differentiation, estrogen hormone receptor test, and PRA, the results found that the survival rate of the group with hormone therapy, as shown in Table 4, had significant differences (p = 0.001 < 0.05), indicating that hormone therapy has an impact on the survival rate of patients with BC, and the relative risk is HR = 3.656, which means that the risk of death without hormonal treatment is 3.656 times higher than that of hormonal treatment. Figure 8 indicates that when all factors are included, the survival rate with hormonal treatment is higher than that without hormonal treatment.
3.1.3. Markov Chain
The Markov matrix is used to determine if a steady state is attained over a long period by accounting for relationship transition changes. The Markov chain is also used to describe the evolution of social and natural phenomena, many of which exhibit distinct phases as time passes. Sorting the cases in order, as indicated in Table 5a,b, Table 6a,b, Table 7a,b, Table 8a,b, Table 9a,b, Table 10a,b, yields the number of individual BC stages from year 1 to 5.
Dividing the number of metastases in the first year by the total number of metastases gives the actual first-year breast cancer rate as shown in Table 5b.
The number of breast cancer cases in the second year can be categorized as shown in Table 6.
Dividing the number of metastases in the second year by the total number of metastases gives the actual breast cancer incidence in the second year as shown in Table 7.
The number of breast cancer cases in the third year can be categorized as shown in Table 8a.
Dividing the number of metastases in the second year by the total number of metastases gives the actual breast cancer incidence in the second year as shown in Table 8b.
The number of breast cancer cases in the fourth year can be categorized as shown in Table 9a.
Dividing the number of metastases in year four by the total number of metastases gives the actual breast cancer incidence in year four (as shown in Table 9b).
The number of breast cancer cases in the fifth year can be categorized as shown in Table 10a.
Dividing the total number of metastases in year five by the total number of metastases in year five gives the actual breast cancer incidence in year five (as shown in Table 10b).
4. Discussion
The survival rate predicted by the metastasis matrix time without difference is comparable to the five-year survival rate of each stage of BC by the National Health Service of the Ministry of Health and Welfare under the long-term stable condition, as shown in Table 11. The model may be built by calculating the probability of survival at each step.
When the actual and predicted survival rates were compared according to Table 12a,b, it was discovered that the actual and predicted survival rates are not significantly different in the first three stages, and the difference between the third and fourth stages is quite large, which may be due to an insufficient number of cases. There are not many deaths in the third and fourth stages, which leads to errors.
SemiMarkov Chain
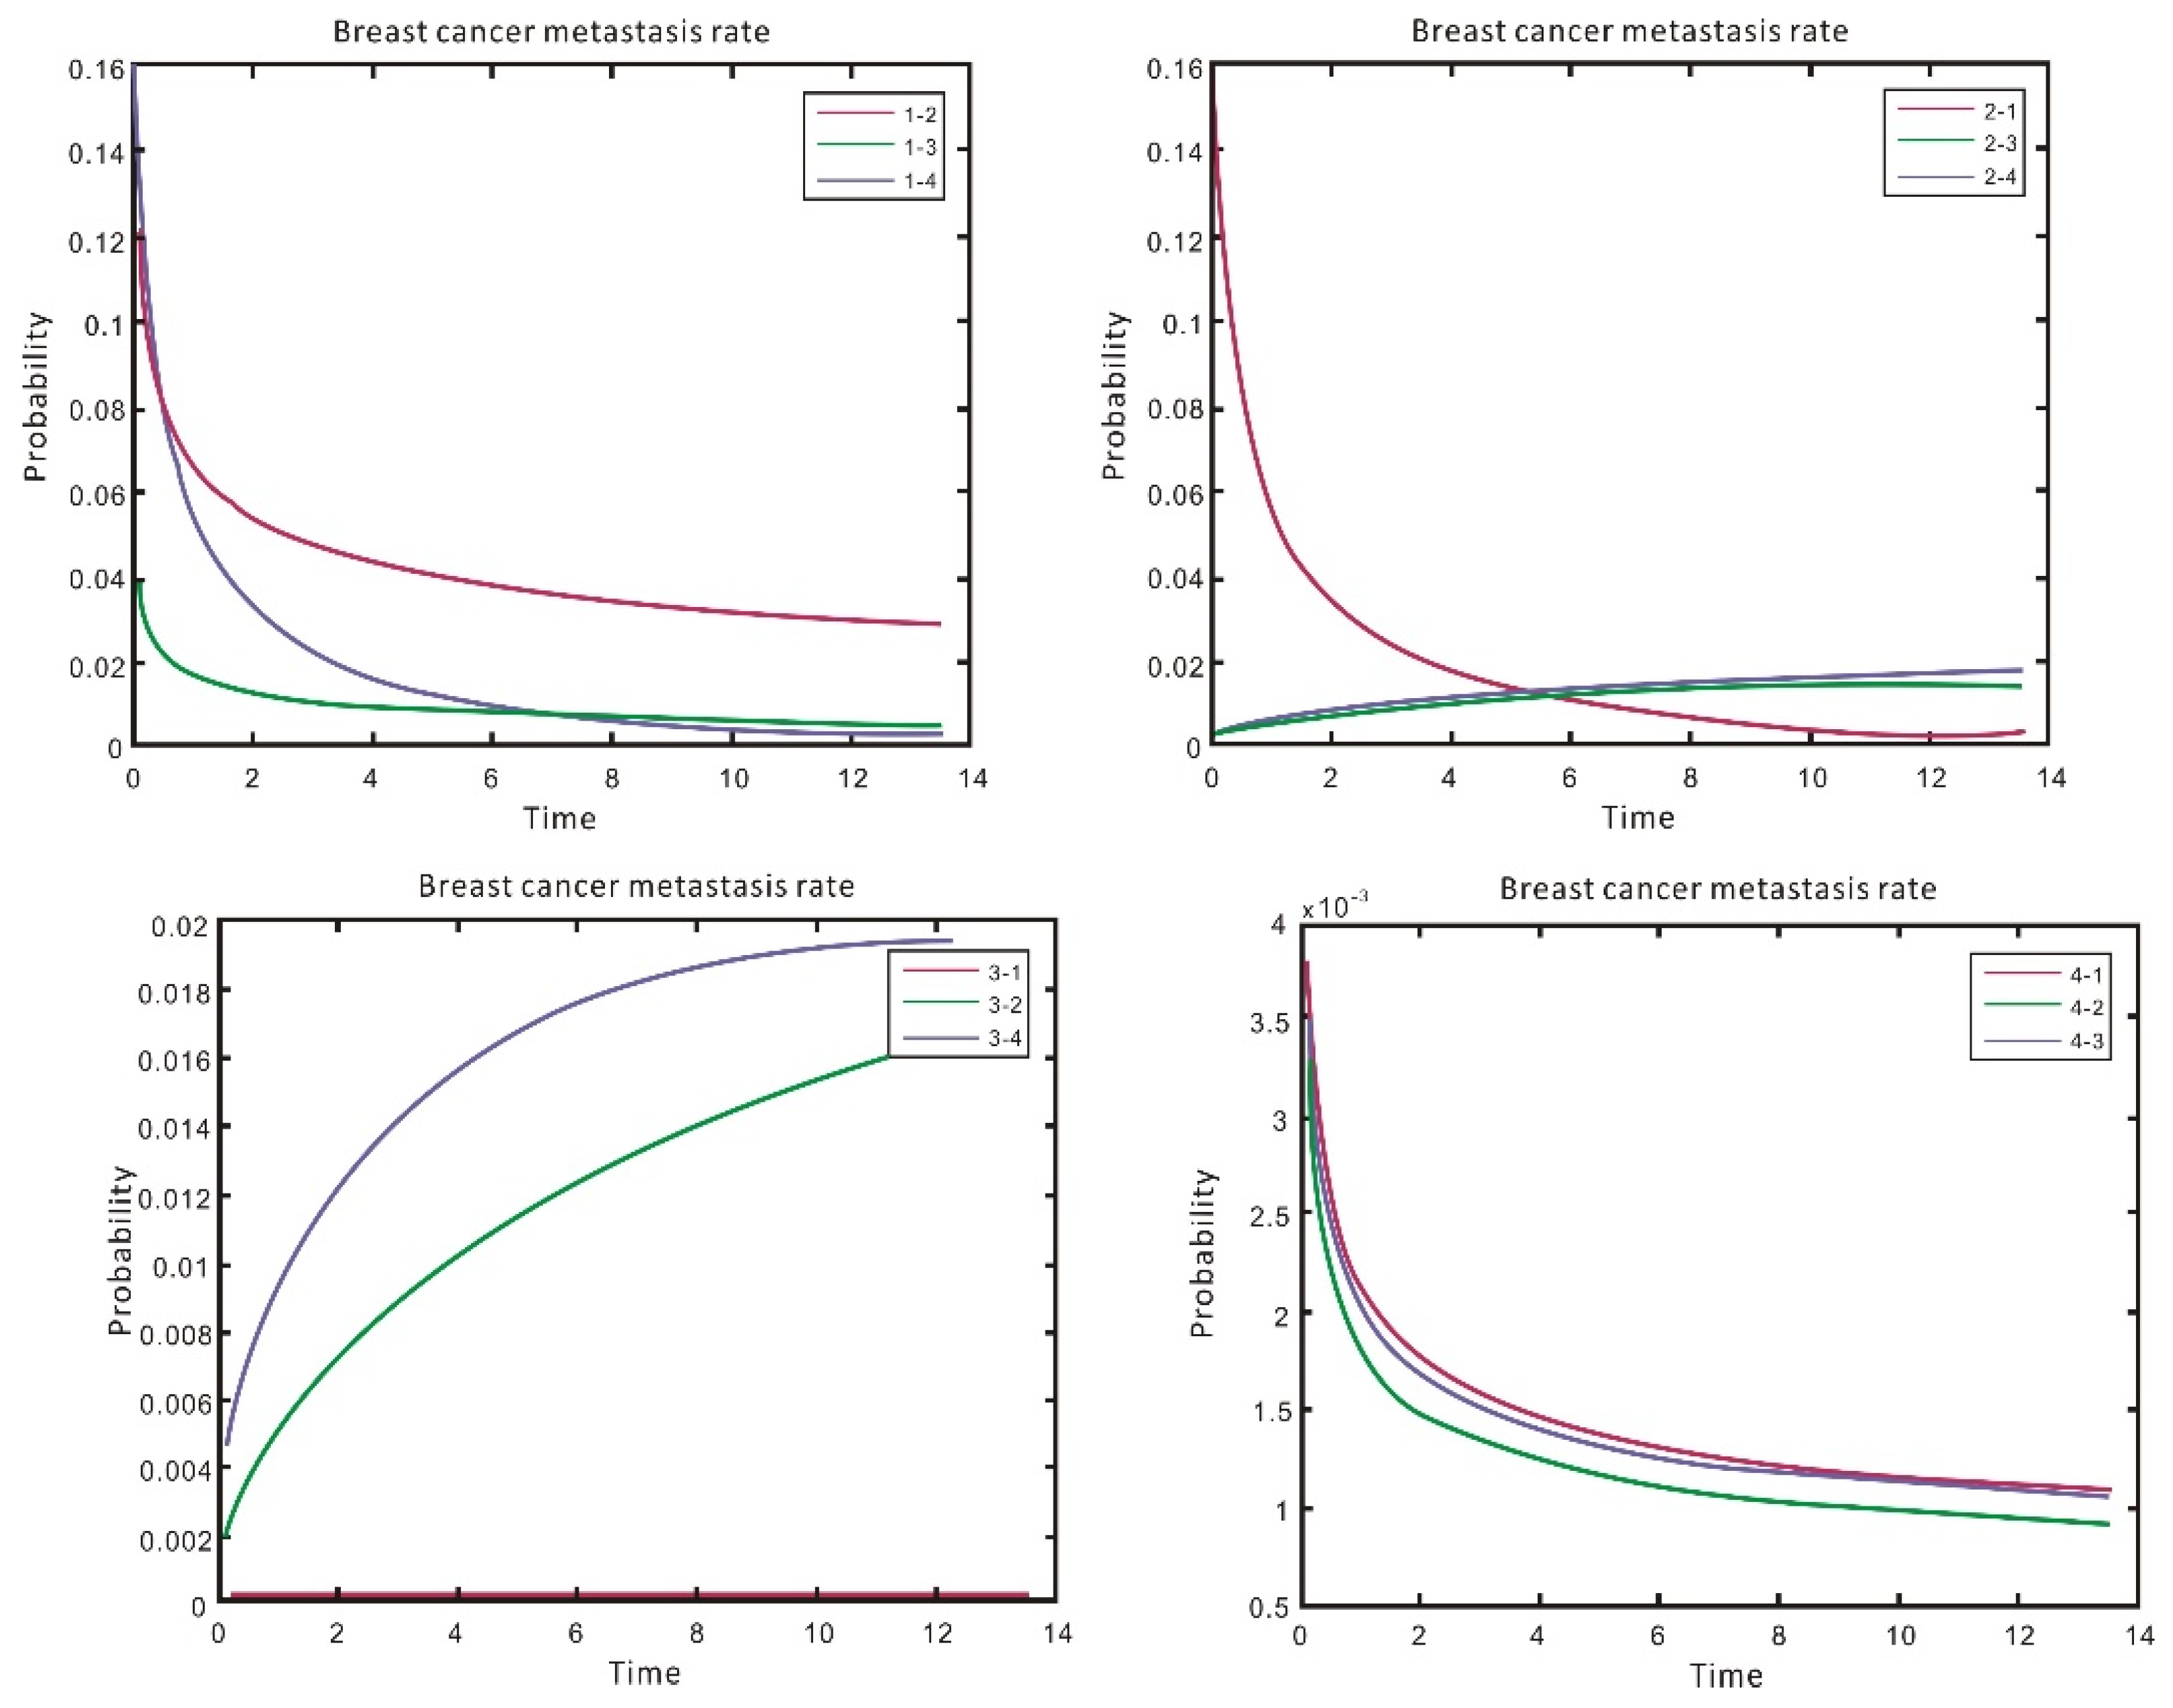
The fundamental model was used to estimate the time-dependent transition rate from one state to another by evaluating each patient’s transfer of the previous state, where the rate value relies on the time spent in the present state using a semi-Markov process-transfer rate. According to Figure 9, the probability of metastasis from stages 1 to 2 is higher than that of stages 3 and 4, indicating that BC is unlikely to deteriorate fast. When BC is at stage 1 it does not metastasize but only when it reaches stage 2. As a result, the probability of BC metastasis is significantly higher than that of BC metastasis in stages 3 and 4. By year 5, the probability of BC metastasis in stages 3 and 4 is higher than that of metastasis in stage 1, suggesting that BC would deteriorate with time and progress to the third stage. It can be seen that the probability of reverting to stage 1 is relatively low but the probability of metastasis transcending to stage 4 is rather high. After stage 4, the probability of metastasis is approximately the same in stages 1, 2, and 3. This indicates that if BC is discovered near the end of the stage, the probability of metastasis in other stages is low. As can be seen in the graph, the majority of the transition probabilities is high at the beginning and decreases with greater duration in a given condition.
A simple linear regression technique is employed to calculate the influence of variables on each transition. The first stage was to construct a univariate model for each covariate, resulting in 48 sets of transformation-specific parameters. These sets include 12 types (4 BC stages, multiplied by 3 potential stages of metastasis) and 4 covariates of the treatment methods. A negative sign of β in the parametric column indicates that the risk of metastasis is higher in the base group than in the other groups, whereas a positive number of β indicates that the risk of metastasis is higher in the non-base group.
As demonstrated in Table 13, hormonal therapy had no significant influence on metastatic risk, as only three cases of metastasis were affected by variations in the patients’ hormonal medication. Surgical therapy, on the other hand, had a substantial influence on metastasis. Patients who had surgery had a lower chance of metastasis among the nine cases studied, whereas those who did not have surgery had a higher risk of metastasis. The results for the treatment covariates reveal that most of the covariates (value 0.05) had negative values in most patients, indicating a lower risk of metastasis in those treated for BC. Finally, 33 relevant factors were chosen from the 48 variables to be included in the single multivariate model based on the statistical test of the univariate model.
Table 14 displays the final multivariate model. In addition, 22 of the 33 variables had a significant influence on patients with specific metastasis, whereas the remaining 11 were excluded from the model due to no significant effect on the chance of a conversion. The final multivariate model estimates also support earlier findings on the influence of therapy on metastatic risk. In most transitions related metastatic cases, patients receiving treatment had a relatively lower risk than those who do not receive treatment, except for chemotherapy patients who received chemotherapy 3→2 had a 1.259-times higher risk than that of patients who did not receive treatment. The relative risk of patients receiving hormonal therapy 1→3 was 2.25 times higher than that of patients receiving no treatment, and the relative risk of patients receiving radiotherapy 2→3 was 1.77 times higher than that of patients receiving radiotherapy. It is observed that most of the important treatment results occur in phases I and II. This study highlights the importance of early identification for most patients with BC, who should undergo treatment as soon as possible. The earlier the BC is discovered, the better the chances of survival and the more important the treatment outcome.
Our results are comparable with earlier studies and are in accordance with [17,18] and have surpassed the prediction of the 5-year survival rate of Guerra et al., 76.3% in five years [19], Rosemeire and Djalma 60.8% [20] and Yuniar and Dian obtained 94.4% in early-stage and 50.3% in advance stage [21].
5. Conclusions
In this study, the survival analysis of BC was initially studied using the chi-square test to assess the independent influence of various types of factors on survival. When the significant variables were submitted to the Kaplan–Meier survival analysis, it was discovered that the significant variables affected the survival of patients with BC when considering the univariate scenario. BC is classified by stage, treatment modality (surgery, chemotherapy, and hormone therapy), ERA, and PRA, although radiation has no bearing on survival, and patients without chemotherapy have a worse survival rate than those with chemotherapy. Next, a Cox proportional risk analysis was performed to examine survival using the treatment method under the influence of multiple variables. It was discovered that patients who received radiotherapy were significantly (p = 0.001) more likely to survive than those who did not receive chemotherapy, implying that the treatment received by the patients was influenced by the various stages.
The Markov chain model was built without taking the survival rate into account in the analysis of BC metastasis, and the matrix showed a steady-state prediction compared with the actual one. However, the prediction was getting closer to the actual one, and each value in each column represented the long-term stable condition. As a result, the Markov chain stage model of BC metastasis can be constructed by utilizing the probability value of each stage’s survival transition, and then the semi-Markov chain model can be established by taking the survival rate into account. The risk of getting surgery for stage I and II patients with BC is lower than the risk of not receiving surgery, whereas the effect of receiving therapy (surgery, radiation, and hormone) for stage III and IV patients are mainly insignificant. The earlier the BC is detected, the better the chances of survival and the more significant the treatment’s success.
Author Contributions
Conceptualization, R.-H.L. and C.-L.C.; methodology, C.-S.L., B.K.K. and Y.-C.C.; software, C.-L.C.; validation, R.-H.L., C.-L.C. and Y.-C.C.; formal analysis, C.-L.C.; investigation, Y.-C.C.; resources, C.-S.L.; data curation, C.-L.C.; writing—original draft preparation, B.K.K. and R.-H.L.; writing—review and editing B.K.K., R.-H.L. and C.-L.C.; All authors have read and agreed to the published version of the manuscript.
Funding
This research was funded by the Ministry of Science and Technology Development Project Foundation of Taiwan (MOST 107-2221-E-027-072-MY2) and the National Taipei University of Technology and Chang Gung Memorial Hospital Joint Research Program (NTUT-CGMH-106-06).
Institutional Review Board Statement
This study was conducted according to the guidelines of the Declaration of Helsinki and approved by the Institutional Review Board of Tri-service General Hospital (2-104-05-087 and 1-108-05-169), Taipei, Taiwan, ROC.
Informed Consent Statement
Informed consent was obtained from all patients involved in this study.
Data Availability Statement
Data available on request due to privacy/ethical restrictions.
Acknowledgments
We wish to acknowledge the support from the Ministry of Science and Technology Development Project Foundation of Taiwan (MOST 107-2221-E-027-072-MY2), and the National Taipei Univer-sity of Technology and Chang Gung Memorial Hospital Joint Research Program (NTUT-CGMH-106-06).
Conflicts of Interest
The authors declare no conflict of interest.
References
- Ginsburg, O.; Bray, F.; Coleman, M.P.; Vanderpuye, V.; Eniu, A.; Kotha, S.R.; Sarker, M.; Huong, T.T.; Allemani, C.; Dvaladze, A.; et al. The global burden of women’s cancers: A grand challenge in global health. Lancet 2017, 389, 847–860. [Google Scholar] [CrossRef]
- Kori, S. An Overview: Several Causes of Breast Cancer. Epidemiology Int. J. 2018, 2. [Google Scholar] [CrossRef]
- Taiwan Health and Welfare Report. 2017. Available online: https://www.mohw.gov.tw/lp-137-2.html (accessed on 19 July 2021).
- Kuo, C.-N.; Liao, Y.-M.; Kuo, L.-N.; Tsai, H.-J.; Chang, W.-C.; Yen, Y. Cancers in Taiwan: Practical insight from epidemiology, treatments, biomarkers, and cost. J. Formos. Med Assoc. 2019, 119, 1731–1741. [Google Scholar] [CrossRef] [PubMed]
- Ali-Gombe, M.; Mustaph, M.I.; Folasire, A.; Ntekim, A.; Campbell, O.B. Pattern of survival of breast cancer patients in a tertiary hospital in south west Nigeria. Ecancermedicalscience 2021, 15, 1192. [Google Scholar] [CrossRef] [PubMed]
- Tesfay, B.; Getinet, T.; Derso, E.A. Survival analysis of Time to Death of Breast Cancer Patients: In case of Ayder Comprehensive Specialized Hospital Tigray, Ethiopia. Cogent Med. 2021, 8, 1908648. [Google Scholar] [CrossRef]
- Hayashi, Y.; Nakano, S. Use of a Recursive-Rule eXtraction algorithm with J48graft to achieve highly accurate and concise rule extraction from a large breast cancer dataset. Informatics Med. Unlocked 2015, 1, 9–16. [Google Scholar] [CrossRef] [Green Version]
- Nguyen, D.; Yu, J.; Reinhold, W.C.; Yang, S.X. Association of Independent Prognostic Factors and Treatment Modality with Survival and Recurrence Outcomes in Breast Cancer. JAMA Netw. Open 2020, 3, e207213. [Google Scholar] [CrossRef] [PubMed]
- Rink, M.; Kluth, L.A.; Shariat, S.F.; Fisch, M.; Dahlem, R.; Dahm, P. Kaplan-Meier-Analysen in der urologischen Praxis. Der Urol. 2013, 52, 838–841. [Google Scholar] [CrossRef] [PubMed]
- Liu, X. The Cox Proportional Hazard Regression Model and Advances. In Survival Analysis; John Wiley & Sons, Ltd.: Hoboken, NJ, USA, 2012; pp. 144–200. [Google Scholar] [CrossRef]
- Plackett, R.L. Karl Pearson and the Chi-Squared Test. Int. Stat. Rev. 1983, 51, 59. [Google Scholar] [CrossRef]
- Ayu, M.A.; Ismail, S.A.; Matin, A.F.A.; Mantoro, T. A Comparison Study of Classifier Algorithms for Mobile-phone’s Accelerometer Based Activity Recognition. Procedia Eng. 2012, 41, 224–229. [Google Scholar] [CrossRef] [Green Version]
- Król, A.; Saint-Pierre, P. SemiMarkov: AnRPackage for Parametric Estimation in Multi-State Semi-Markov Models. J. Stat. Softw. 2015, 66, 1–16. [Google Scholar] [CrossRef]
- Foucher, Y.; Mathieu, E.; Saint-Pierre, P.; Durand, J.-F.; Daurès, J.-P. A Semi-Markov Model Based on Generalized Weibull Distribution with an Illustration for HIV Disease. Biom. J. 2005, 47, 825–833. [Google Scholar] [CrossRef] [PubMed]
- Wald Test—An Overview | ScienceDirect Topics. Available online: https://www.sciencedirect.com/topics/mathematics/wald-test (accessed on 30 August 2021).
- Downloading IBM SPSS Statistics 22. 2021. Available online: https://www.ibm.com/support/pages/downloading-ibm-spss-statistics-22 (accessed on 30 August 2021).
- Gordon, N.H. Socioeconomic factors and breast cancer in black and white Americans. Cancer Metastasis Rev. 2003, 22, 55–65. [Google Scholar] [CrossRef] [PubMed]
- Rezaianzadeh, A.; Peacock, J.; Reidpath, D.; Talei, A.; Hosseini, S.V.; Mehrabani, D. Survival analysis of 1148 women diagnosed with breast cancer in Southern Iran. BMC Cancer 2009, 9, 168. [Google Scholar] [CrossRef] [PubMed] [Green Version]
- Guerra, M.R.; E Silva, G.A.; Nogueira, M.C.; Leite, I.C.G.; Oliveira, R.D.V.C.D.; Cintra, J.R.D.; Bustamante-Teixeira, M.T. Breast cancer survival and health inequalities. BMC Cancer 2015, 31, 1673–1684. [Google Scholar] [CrossRef] [Green Version]
- Ferraz, R.D.O.; Moreira-Filho, D.D.C. Survival analysis of women with breast cancer: Competitive risk models. Ciência Saúde Coletiva 2017, 22, 3743–3754. [Google Scholar] [CrossRef] [PubMed]
- Farida, Y.; Maulida, E.A.; Desinaini, L.N.; Utami, W.D.; Yuliati, D. Breast Cancer Survival Analysis Using Cox Proportional Hazard Regression and Kaplan Meier Method. JTAM J. Teori Dan Apl. Mat. 2021, 5, 340–358. [Google Scholar] [CrossRef]
Figure 1.
Research architecture.

Figure 2.
Markov chain matrix.

Figure 3.
Breast cancer estrogen receptor test (ERA) survival analysis.

Figure 4.
Breast cancer progesterone receptor test (PRA) survival analysis.

Figure 5.
Surgical treatment of Cox survival analysis.

Figure 6.
Radiotherapy of Cox survival analysis.

Figure 7.
Chemotherapy Cox survival analysis.

Figure 8.
Cox survival analysis of hormone therapy.

Figure 9.
Probability of breast cancer metastasis rate.


Table 1.
Basic attributes of breast cancer patients.
| Variables | Value (%) | Variables | Value (%) |
|---|---|---|---|
| Gender | Behavior code | ||
| Male | 6 (0.3%) | Carcinoma in situ | 340 (16.3%) |
| Female | 2083 (99.7%) | invasive Carcinoma | 1749 (83.7%) |
| Age | Graded differentiation | ||
| >45 years | 1644 (78.7%) | Well differentiated | 257 (12.3%) |
| <45 years | 445 (21.3%) | moderate differentiation | 844 (40.4%) |
| Poor differentiation | 775 (37.1%) | ||
| Unknown | 213 (10.2%) | ||
| Clinical Stage | Pathological stage combination | ||
| 0 | 315 (15.1%) | 0 | 343 (16.4%) |
| 1 | 464 (22.2%) | 1 | 432 (20.7%) |
| 1A | 371 (17.8%) | 1A | 323 (15.0%) |
| 2A | 640 (30.6%) | 2A | 500 (23.9%) |
| 2B | 160 (7.7%) | 2B | 201 (9.6%) |
| 3A | 64 (3.1%) | 3A | 159 (7.6%) |
| 3B | 26 (1.2%) | 3B | 15 (0.7%) |
| 3C | 13 (0.6%) | 3C | 79 (3.8%) |
| 4 | 36 (1.7%) | 4 | 37 (1.8%) |
| Surgical Treatment | Radiotherapy | ||
| No | 52 (2.5%) | No | 1040 (49.8%) |
| Yes | 2037 (97.5%) | Yes | 1027 (49.2%) |
| Chemotherapy | Hormone Therapy | ||
| No | 908 (43.5%) | No | 578 (27.7%) |
| Yes | 1179 (56.4%) | Yes | 1506 (72.1%) |
| unknown | 2 (0.1%) | unknown | 5 (0.2%) |
| Estrogen Receptor Test (ERA) | Progesterone Receptor Test (PRA) | ||
| (−) Negative | 532 (25.5%) | (−) Negative | 488 (23.4%) |
| (+) low positive | 222 (10.5%) | (+) low positive | 480 (23.0%) |
| (+) medium Positive | 297 (14.2%) | (+) medium Positive | 365 (17.5%) |
| (+) High Positive | 829 (39.7%) | (+) High Positive | 542 (25.9%) |
| (+) Positive unknown | 13 (0.6%) | (+) Positive unknown | 16 (0.8%) |
| Non-breast cancer patient | 184 (8.8%) | Non-breast cancer patient | 185 (8.8%) |
| Condition unknown or undetected | 12 (0.6%) | Condition unknown or undetected | 13 (0.6%) |
| Survival rate | |||
| Died | 53 (2.5%) | ||
| Survived | 2036 (97.5%) |
Table 2.
Survival analysis of estrogen receptor test (ERA) for breast cancer.
| Classification | Total Number | Number of Deaths | Average Months of Survival | Standard Error |
|---|---|---|---|---|
| (−) Negative | 532 | 31 | 82.512 | 0.951 |
| (+) low positive | 222 | 4 | 85.463 | 0.759 |
| (+) medium positive | 297 | 5 | 84.532 | 1.533 |
| (+) high positive | 829 | 9 | 86.703 | 0.432 |
| (+) positives unknown | 13 | 1 | 80.000 | 2.806 |
Table 3.
Survival analysis of progesterone receptor test (PRA) for breast cancer.
| Classification | Total Number | Number of Deaths | Average Months of Survival | Standard Error |
|---|---|---|---|---|
| (−) Negative | 488 | 24 | 82.606 | 1.075 |
| (+) low positive | 480 | 12 | 85.280 | 0.795 |
| (+) medium positive | 365 | 6 | 83.186 | 0.757 |
| (+) high positive | 542 | 7 | 86.690 | 0.491 |
| (+) positives unknown | 16 | 1 | 81.000 | 1.915 |
Table 4.
Surgical treatment risk ratio.
| Treatment | Significance | Risk Ratio | 95% Confidence Interval of Risk Ratio | |
|---|---|---|---|---|
| Lower Limit | Upper Limit | |||
| Surgical treatment | 0.004 * | 1.650 | 0.584 | 4.665 |
| Radiotherapy | 0.002 * | 1.155 | 0.584 | 4.665 |
| Chemotherapy | 0.000 * | 1.415 | 0.633 | 3.162 |
| Hormone therapy | 0.000 * | 3.656 | 2.051 | 6.515 |
* indicates significant difference.
Table 5.
Number of people with breast cancer in the first year.
| (a) Number of Individuals with Breast Cancer in the First Year | |||||||
| First Year | Stage 0 | Stage 1 | Stage 2 | Stage 3 | Stage 4 | Deaths | Total |
| Stage 0 | 25 | 7 | 1 | 0 | 0 | 0 | 33 |
| Stage 1 | 27 | 121 | 30 | 3 | 0 | 1 | 182 |
| Stage 2 | 9 | 33 | 113 | 29 | 0 | 3 | 187 |
| Stage 3 | 1 | 3 | 4 | 7 | 1 | 4 | 20 |
| Stage 4 | 0 | 0 | 0 | 0 | 8 | 5 | 13 |
| Deaths | 0 | 0 | 0 | 0 | 0 | 0 | 0 |
| (b) Total Metastases of Breast Cancer in the First Year | |||||||
| First Year | Stage 0 | Stage 1 | Stage 2 | Stage 3 | Stage 4 | Deaths | |
| Stage 0 | 0.758 | 0.212 | 0.030 | 0.000 | 0.000 | 0.000 | |
| Stage 1 | 0.148 | 0.665 | 0.165 | 0.016 | 0.000 | 0.005 | |
| Stage 2 | 0.048 | 0.176 | 0.604 | 0.155 | 0.000 | 0.016 | |
| Stage 3 | 0.050 | 0.150 | 0.200 | 0.350 | 0.050 | 0.200 | |
| Stage 4 | 0.000 | 0.000 | 0.000 | 0.000 | 0.615 | 0.385 | |
| Deaths | 0.000 | 0.000 | 0.000 | 0.000 | 0.000 | 1.000 | |
Table 6.
Number of people with breast cancer in the second year.
| Second Year | Stage 0 | Stage 1 | Stage 2 | Stage 3 | Stage 4 | Deaths | Total |
|---|---|---|---|---|---|---|---|
| Stage 0 | 69 | 10 | 2 | 0 | 0 | 0 | 81 |
| Stage 1 | 9 | 130 | 44 | 14 | 0 | 1 | 198 |
| Stage 2 | 3 | 27 | 86 | 40 | 0 | 4 | 160 |
| Stage 3 | 0 | 0 | 7 | 23 | 0 | 6 | 36 |
| Stage 4 | 0 | 0 | 0 | 0 | 5 | 2 | 7 |
| Deaths | 0 | 0 | 0 | 0 | 0 | 0 | 0 |
Table 7.
Total metastases of breast cancer in the second year.
| Second Year | Stage 0 | Stage 1 | Stage 2 | Stage 3 | Stage 4 | Deaths |
|---|---|---|---|---|---|---|
| Stage 0 | 0.852 | 0.123 | 0.025 | 0.000 | 0.000 | 0.000 |
| Stage 1 | 0.045 | 0.657 | 0.222 | 0.071 | 0.000 | 0.005 |
| Stage 2 | 0.019 | 0.169 | 0.538 | 0.250 | 0.000 | 0.025 |
| Stage 3 | 0.000 | 0.000 | 0.194 | 0.639 | 0.000 | 0.167 |
| Stage 4 | 0.000 | 0.000 | 0.000 | 0.000 | 0.714 | 0.286 |
| Deaths | 0.000 | 0.000 | 0.000 | 0.000 | 0.000 | 1.000 |
Table 8.
Number of people with breast cancer in the third year.
| (a) Number of Individuals with Breast Cancer in the Third Year | |||||||
| Third Year | Stage 0 | Stage 1 | Stage 2 | Stage 3 | Stage 4 | Deaths | Total |
| Stage 0 | 41 | 19 | 0 | 0 | 0 | 1 | 61 |
| Stage 1 | 2 | 69 | 27 | 6 | 0 | 1 | 105 |
| Stage 2 | 5 | 14 | 61 | 26 | 0 | 4 | 110 |
| Stage 3 | 2 | 1 | 4 | 4 | 0 | 2 | 13 |
| Stage 4 | 0 | 0 | 0 | 0 | 6 | 3 | 9 |
| (b) Total Metastases of Breast Cancer in the Third Year | |||||||
| Third Year | Stage 0 | Stage 1 | Stage 2 | Stage 3 | Stage 4 | Deaths | |
| Stage 0 | 0.672 | 0.311 | 0.000 | 0.000 | 0.000 | 0.016 | |
| Stage 1 | 0.019 | 0.657 | 0.257 | 0.057 | 0.000 | 0.010 | |
| Stage 2 | 0.045 | 0.127 | 0.555 | 0.236 | 0.000 | 0.036 | |
| Stage 3 | 0.154 | 0.077 | 0.308 | 0.308 | 0.000 | 0.154 | |
| Stage 4 | 0.000 | 0.000 | 0.000 | 0.000 | 0.667 | 0.333 | |
| Deaths | 0.000 | 0.000 | 0.000 | 0.000 | 0.000 | 1.000 | |
Table 9.
Number of people with breast cancer in the fourth year.
| (a) Number of People with Breast Cancer in the Fourth Year | |||||||
| Fourth Year | Stage 0 | Stage 1 | Stage 2 | Stage 3 | Stage 4 | Deaths | Total |
| Stage 0 | 42 | 6 | 2 | 0 | 0 | 0 | 50 |
| Stage 1 | 6 | 77 | 26 | 6 | 0 | 1 | 116 |
| Stage 2 | 3 | 19 | 58 | 20 | 0 | 1 | 101 |
| Stage 3 | 0 | 2 | 4 | 4 | 0 | 1 | 11 |
| Stage 4 | 0 | 0 | 0 | 0 | 1 | 1 | 2 |
| Deaths | 0 | 0 | 0 | 0 | 0 | 0 | 0 |
| (b) Total Metastases of Breast Cancer in the Fourth Year | |||||||
| Fourth Year | Stage 0 | Stage 1 | Stage 2 | Stage 3 | Stage 4 | Deaths | |
| Stage 0 | 0.840 | 0.120 | 0.040 | 0.000 | 0.000 | 0.000 | |
| Stage 1 | 0.052 | 0.664 | 0.224 | 0.052 | 0.000 | 0.009 | |
| Stage 2 | 0.030 | 0.188 | 0.574 | 0.198 | 0.000 | 0.010 | |
| Stage 3 | 0.000 | 0.182 | 0.364 | 0.364 | 0.000 | 0.091 | |
| Stage 4 | 0.000 | 0.000 | 0.000 | 0.000 | 0.500 | 0.500 | |
| Deaths | 0.000 | 0.000 | 0.000 | 0.000 | 0.000 | 1.000 | |
Table 10.
Number of People with Breast Cancer in the Fifth Year.
| (a) Number of Breast Cancer Patients in the Fifth Year | |||||||
| Fifth Year | Stage 0 | Stage 1 | Stage 2 | Stage 3 | Stage 4 | Deaths | Total |
| Stage 0 | 25 | 2 | 1 | 0 | 0 | 0 | 28 |
| Stage 1 | 6 | 81 | 18 | 4 | 0 | 1 | 110 |
| Stage 2 | 5 | 17 | 59 | 10 | 0 | 1 | 92 |
| Stage 3 | 0 | 0 | 1 | 4 | 0 | 4 | 9 |
| Stage 4 | 0 | 0 | 0 | 0 | 3 | 1 | 4 |
| (b) Total Metastases of Breast Cancer in the Fifth Year | |||||||
| Fifth Year | Stage 0 | Stage 1 | Stage 2 | Stage 3 | Stage 4 | Deaths | |
| Stage 0 | 0.893 | 0.071 | 0.03 | 0.000 | 0.000 | 0.001 | |
| Stage 1 | 0.055 | 0.736 | 0.164 | 0.036 | 0.000 | 0.009 | |
| Stage 2 | 0.054 | 0.185 | 0.641 | 0.109 | 0.000 | 0.011 | |
| Stage 3 | 0.000 | 0.000 | 0.111 | 0.444 | 0.000 | 0.444 | |
| Stage 4 | 0.000 | 0.000 | 0.000 | 0.000 | 0.750 | 0.250 | |
| Deaths | 0.000 | 0.000 | 0.000 | 0.000 | 0.000 | 1.000 | |
Table 11.
Comparison of survival rates.
| Stage | Five-Year Survival Rate (Department of Health) | Five-Year Survival Rate (No Time Difference in Transition Matrix) | Five-Year Survival Rate (Time Difference in Transition Matrix) |
|---|---|---|---|
| Stage 0 | 97.7% | 99.6% | 85.2% |
| Stage 1 | 95.2% | 93.9% | 96.0% |
| Stage 2 | 92.3% | 91.2% | 37.3% |
| Stage 3 | 89.7% | 85.3% | 85.4% |
| Stage 4 | 25.7% | 25.3% | 18.8% |
Table 12.
Comparison of five years actual and predicted survival rates.
| (a) Comparison of Actual and Predicted Survival Rates | ||||||
| Stage | Actual Survival Rate | Predicted Survival Rate | ||||
| Stage 0 | 99.9% | 99.6% | ||||
| Stage 1 | 99.1% | 93.9% | ||||
| Stage 2 | 98.9% | 91.2% | ||||
| Stage 3 | 55.6% | 85.3% | ||||
| Stage 4 | 75.0% | 25.3% | ||||
| (b) Five Years of Actual and Predicted Survival Rates | ||||||
| Fifth Year Forecast | Stage 0 | Stage 1 | Stage 2 | Stage 3 | Stage 4 | Deaths |
| Stage 0 | 0.635 | 0.172 | 0.125 | 0.064 | 0 | 0.004 |
| Stage 1 | 0.216 | 0.213 | 0.301 | 0.209 | 0 | 0.061 |
| Stage 2 | 0.164 | 0.251 | 0.203 | 0.294 | 0 | 0.088 |
| Stage 3 | 0.1673 | 0.191 | 0.271 | 0.222 | 0.002 | 0.147 |
| Stage 4 | 0 | 0 | 0 | 0 | 0.254 | 0.746 |
| Deaths | 0 | 0 | 0 | 0 | 0 | 1.000 |
Table 13.
Covariate parameters and p-values of each univariate model.
| Transition State | Surgical Treatment | Radiotherapy | Chemotherapy | Hormonal Therapy | ||||
|---|---|---|---|---|---|---|---|---|
| Parameters | p Value | Parameters | p Value | Parameters | p Value | Parameters | p Value | |
| 1→2 | −1.691 | <0.001 * | 0.117 | 0.0769 | −7.176 | <0.001 * | 0.109 | 0.1253 |
| 1→3 | −2.237 | <0.001 * | −1.487 | <0.001 * | −1.745 | <0.001 * | −1.278 | <0.001 * |
| 1→4 | −3.216 | <0.001 * | −0.244 | <0.001 * | −3.294 | <0.001 * | −3.964 | <0.001 * |
| 2→1 | 2.892 | <0.001 * | −1.084 | <0.001 * | −8.965 | 0.0014 * | 0.008 | 0.543 |
| 2→3 | 3.762 | <0.001 * | 1.632 | <0.001 * | 9.44 | 0.639 | 0.305 | 0.259 |
| 2→4 | −2.493 | 0.1463 | −1.830 | <0.001 * | −8.51 | 0.920 | 1.075 | 0.427 |
| 3→1 | −1.254 | <0.001 * | −1.500 | <0.001 * | −5.52 | 0.020 * | −0.891 | 0.0012 * |
| 3→2 | −0.246 | 0.466 | 3.728 | <0.001 * | 2.495 | 0.032 * | 0.305 | 0.3897 |
| 3→4 | −3.237 | 0.0037 * | −2.79 | <0.001 * | −2.872 | 0.654 | −2.054 | 0.0288 * |
| 4→1 | −5.495 | <0.001 * | −6.071 | <0.001 * | −1.003 | <0.001 * | 6.568 | <0.001 * |
| 4→2 | −2.650 | 0.949 | −8.503 | <0.001 * | −8.75 | 0.075 | 7.075 | <0.001 * |
| 4→3 | 1.810 | 0.2694 | 12.253 | <0.001 * | −1.29 | <0.001 * | 2.400 | 0.124 |
Note: * means significant.
Table 14.
Covariate parameters of the multivariate model.
| Covariate | Transition State | Parameters β | Relative Risk | p Value |
|---|---|---|---|---|
| Surgical treatment | 1→2 | −1.47 | 0.230 | <0.001 * |
| Surgical treatment | 1→3 | −2.40 | 0.091 | <0.001 * |
| Surgical treatment | 1→4 | −2.74 | 0.065 | <0.001 * |
| Surgical treatment | 2→1 | −4.22 | 0.015 | <0.001 * |
| Surgical treatment | 2→3 | −3.105 | 0.045 | <0.001 * |
| Surgical treatment | 2→4 | −2.46 | 0.085 | <0.001 * |
| Surgical treatment | 3→1 | −1.33 | 0.264 | <0.001 * |
| Chemotherapy | 1→2 | −0.44 | 0.644 | 0.007 |
| Chemotherapy | 3→2 | 0.23 | 1.259 | 0.495 |
| Chemotherapy | 4→3 | −3.97 | 0.019 | 0.021 |
| Hormonal therapy | 1→3 | 0.811 | 2.250 | 0.0177 |
| Hormonal therapy | 1→4 | −1.10 | 0.333 | 0.021 |
| Hormonal therapy | 3→4 | −1.62 | 0.198 | <0.001 * |
| Radiotherapy | 1→2 | −0.421 | 0.656 | 0.0393 |
| Radiotherapy | 1→3 | −1.10 | 0.333 | 0.0439 |
| Radiotherapy | 2→3 | 0.571 | 1.770 | <0.001 * |
| Radiotherapy | 2→4 | −0.562 | 0.570 | <0.001 * |
| Radiotherapy | 3→2 | 0.824 | 2.280 | <0.001 * |
Note: * means significant.
Publisher’s Note: MDPI stays neutral with regard to jurisdictional claims in published maps and institutional affiliations. |
© 2022 by the authors. Licensee MDPI, Basel, Switzerland. This article is an open access article distributed under the terms and conditions of the Creative Commons Attribution (CC BY) license (https://creativecommons.org/licenses/by/4.0/).
Share and Cite
MDPI and ACS Style
Lin, R.-H.; Lin, C.-S.; Chuang, C.-L.; Kujabi, B.K.; Chen, Y.-C. Breast Cancer Survival Analysis Model. Appl. Sci. 2022, 12, 1971. https://doi.org/10.3390/app12041971
AMA Style
Lin R-H, Lin C-S, Chuang C-L, Kujabi BK, Chen Y-C. Breast Cancer Survival Analysis Model. Applied Sciences. 2022; 12(4):1971. https://doi.org/10.3390/app12041971
Chicago/Turabian StyleLin, Rong-Ho, Ching-Shun Lin, Chun-Ling Chuang, Benjamin Kofi Kujabi, and Yen-Chen Chen. 2022. "Breast Cancer Survival Analysis Model" Applied Sciences 12, no. 4: 1971. https://doi.org/10.3390/app12041971
Note that from the first issue of 2016, this journal uses article numbers instead of page numbers. See further details here.