
Numerical Study of the Induced Shock on the Mixing Augmentation of Hydrogen Counter-Flow Jet in the Supersonic Flow


College of Aerospace Science and Engineering, National University of Defense Technology, 109 Deya Road, Changsha 410073, China
*
Author to whom correspondence should be addressed.
Aerospace 2022, 9(9), 506; https://doi.org/10.3390/aerospace9090506
Submission received: 15 August 2022
/
Revised: 7 September 2022
/
Accepted: 8 September 2022
/
Published: 11 September 2022
(This article belongs to the Special Issue Jet Flow Analysis)
Abstract
:In the scramjet engine, the injection and mixing of fuel are the basis for organizing efficient combustion. The shock wave/jet shear layer interaction is one of the methods used to enhance fuel mixing in supersonic flow. In this research, the effect of the induced shock wave on the mixing augmentation of fuel counter-flow jet is studied in the supersonic crossflow. The results show that the symmetrical setting of the shock wave generators (SWGs) has the highest mixing efficiency but brings a greater total pressure loss. In the specific range, the mixing efficiency increases with the increase in the angle of the SWG, while the total pressure recovery coefficient is the opposite. The induced oblique shock wave acting on the front of the fuel jet has an obvious influence on the flow field, resulting in the highest mixing efficiency. In the end, the analytic hierarchy process (AHP) is used to evaluate the extent of mixing augmentation by mixing parameters, which provides a decision-making idea for the scheme decision of mixing augmentation.
1. Introduction
The scramjet engine, as the ideal propulsion system for an air-breathing hypersonic vehicle, has been proposed by many countries [1,2,3], but its development is still facing many challenges so far. Due to the high speed of hypersonic aircraft, the retention time of airflow in the internal flow path is only a few milliseconds [4]. Therefore, the fuel jet and the efficient mixing of air and fuel become the basis for stable combustion and continuous thrust. Seiner et al. [4] sorted out and summarized the mixing enhancement methods commonly used in the scramjet engine, which were divided into active and passive mixing enhancement. Huang [5] summarized the advantages and disadvantages of various mixing enhancement methods.
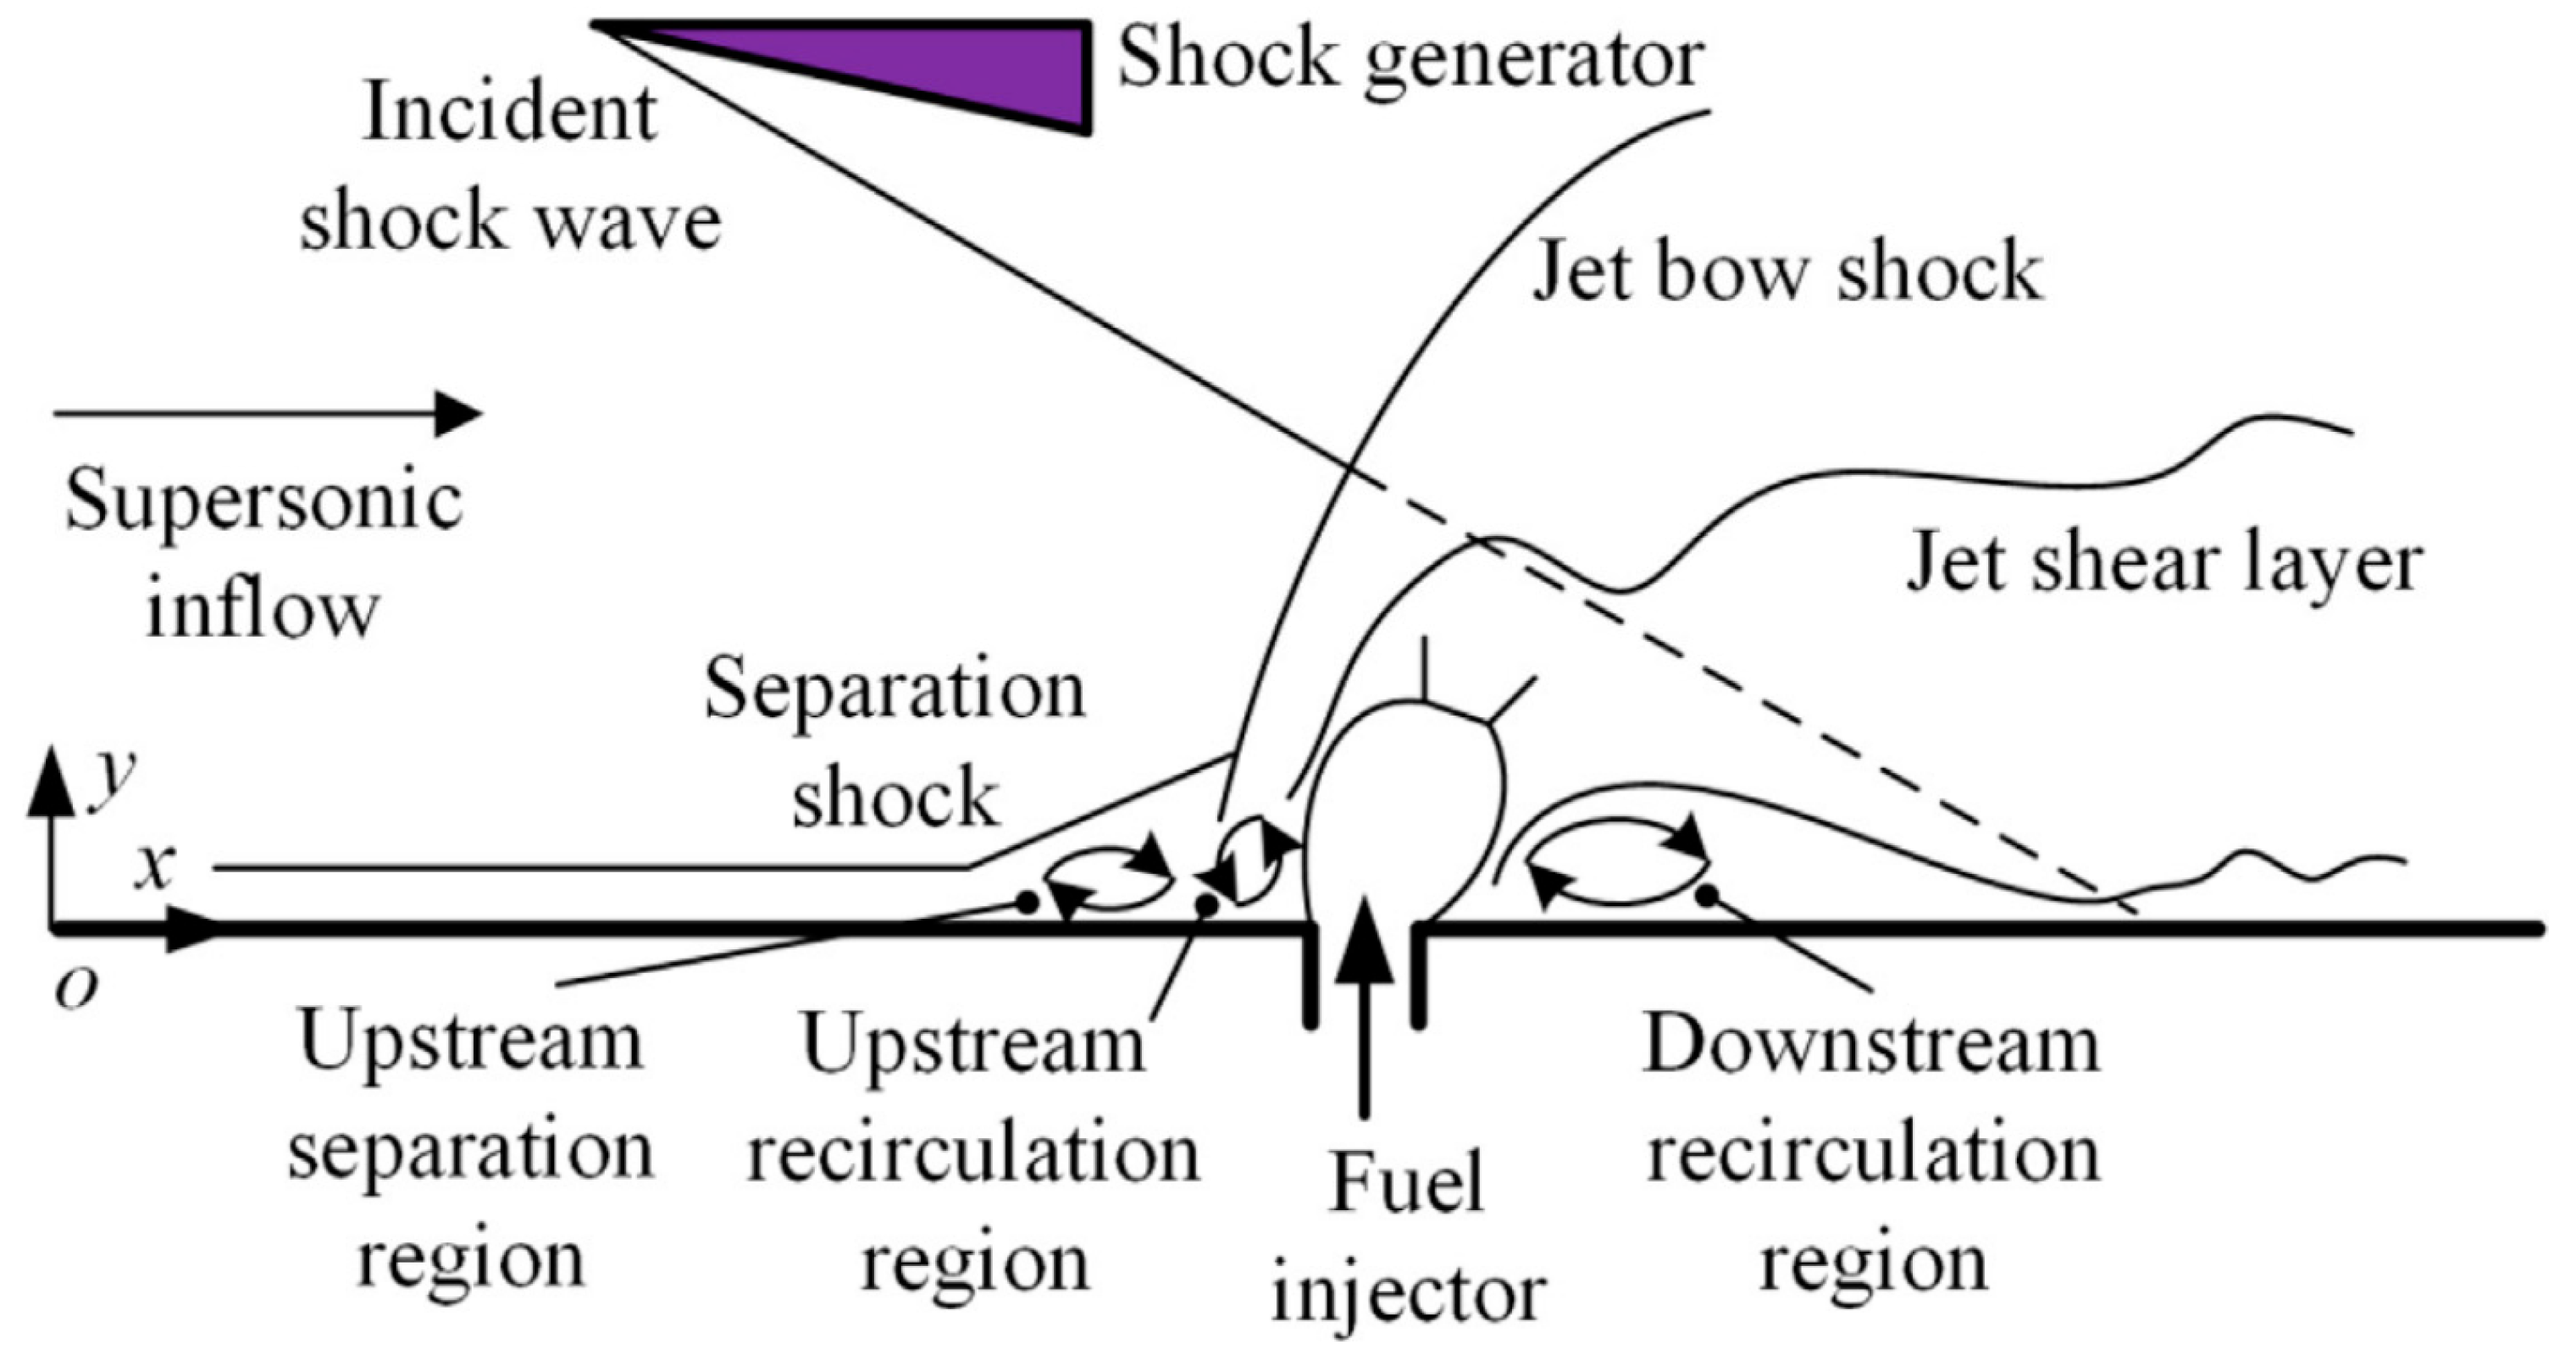
By generating an oblique shock wave, shock/jet shear layer interaction is an effective method to promote mixing enhancement [6], which is a passive mixing enhancement method. An oblique shock wave, acting on the jet flow field, influences the flow field in the recirculation zone and the vortex structure. As for the pressure gradient generated by the oblique shock wave and the action of the oblique pressure moment, the strong streamwise vorticity is generated at the interface between fuel and air to realize the mixing enhancement. The flow field structure of shock/jet shear layer interaction for transverse injection is shown in Figure 1 [7]. In the supersonic crossflow, the induced oblique shock wave has a significant influence on fuel distribution [8], wall pressure [9], mixing speed [10], and combustion efficiency [11].
Zhao et al. [12] studied the impact of the shock train effect induced by an inlet compression ramp on mixing and found that an oblique shock wave formed a zone near the jet, which facilitated fuel mixing. He studied the probability density function of the mixing fraction to achieve the coexistence and interaction of large-scale structures behind oblique shock waves that accelerated the fuel mixing. Li et al. [13] used numerical simulation to study the influence of wedge-shaped SWG on fuel mixing in the supersonic flow field of Ma = 4.0. Comparing the vortex structure in the cavity of different cases, he found that the SWG made the main flow into the cavity, reduced the temperature in the cavity, and enhanced the fuel mixing. Huang [14] investigated and evaluated the effect of jet position and jet-inflow pressure ratio on the mixing augmentation mechanism. He found that the oblique shock wave prolonged the residence time of hydrogen in supersonic flow, and the hydrogen distribution moves upward with the oblique shock wave. Zuo et al. [15] investigated the effects of oblique shock on the mixing characteristics in the combustor with a cavity. He found that an optimal angle existed for the mixing efficiency of the ramp, while the optimal angle diminished as the jet-to-crossflow pressure ratio increased. In addition, the oblique shock wave was made to promote the penetration depth of fuel in a certain range. Moreover, the total pressure loss decreased with the diminishing angle of the SWG. An et al. [16] investigated the effect of the SWG and equivalence ratio on the combustion mode of a strut-based supersonic combustor. He found that the SWG increased the combustible mixture’s residence time by extending the recirculation flow length and elevated the strut wake’s temperature and pressure, which significantly accelerated the auto-ignition process. Du et al. [7] utilized the shock wave/jet shear layer interaction to promote the hydrogen mixing augmentation in a supersonic flow, investigating the action location between the induced shock wave and the air inflow, as well as the intensity of the shock wave to get the mixing augmentation mechanism. He found that the mixing speed and mixing efficiency increased with the increase in the shock wave intensity. The mixing augmentation mechanism was that the enhancement of upstream vorticity and spanwise vorticity promoted the increase in the upstream separation zone and recirculation zone.
As for the high-enthalpy supersonic crossflow, Liu [17,18] investigated the mixing and combustion characteristics of a three-dimensional unsteady reacting flow field generated by a transverse hydrogen jet. By the numerical method, he utilized the hybrid RANS/LES (Reynolds-Averaged/Large Eddy Simulation) method to verify the jet penetration height, time-averaged, and instantaneous structures of the reacting flow field. He found that the large-scale coherent structures induced by Kelvin–Helmholtz instability of the jet shear layer promoted combustion by enhancing the fuel mixing and enlarging the reacting area [17]. Moreover, he found that the autoignition process, which plays a critical role in stabilizing supersonic combustion, shows to favor a fuel-lean or not very fuel-rich environment of a high enthalpy [18].
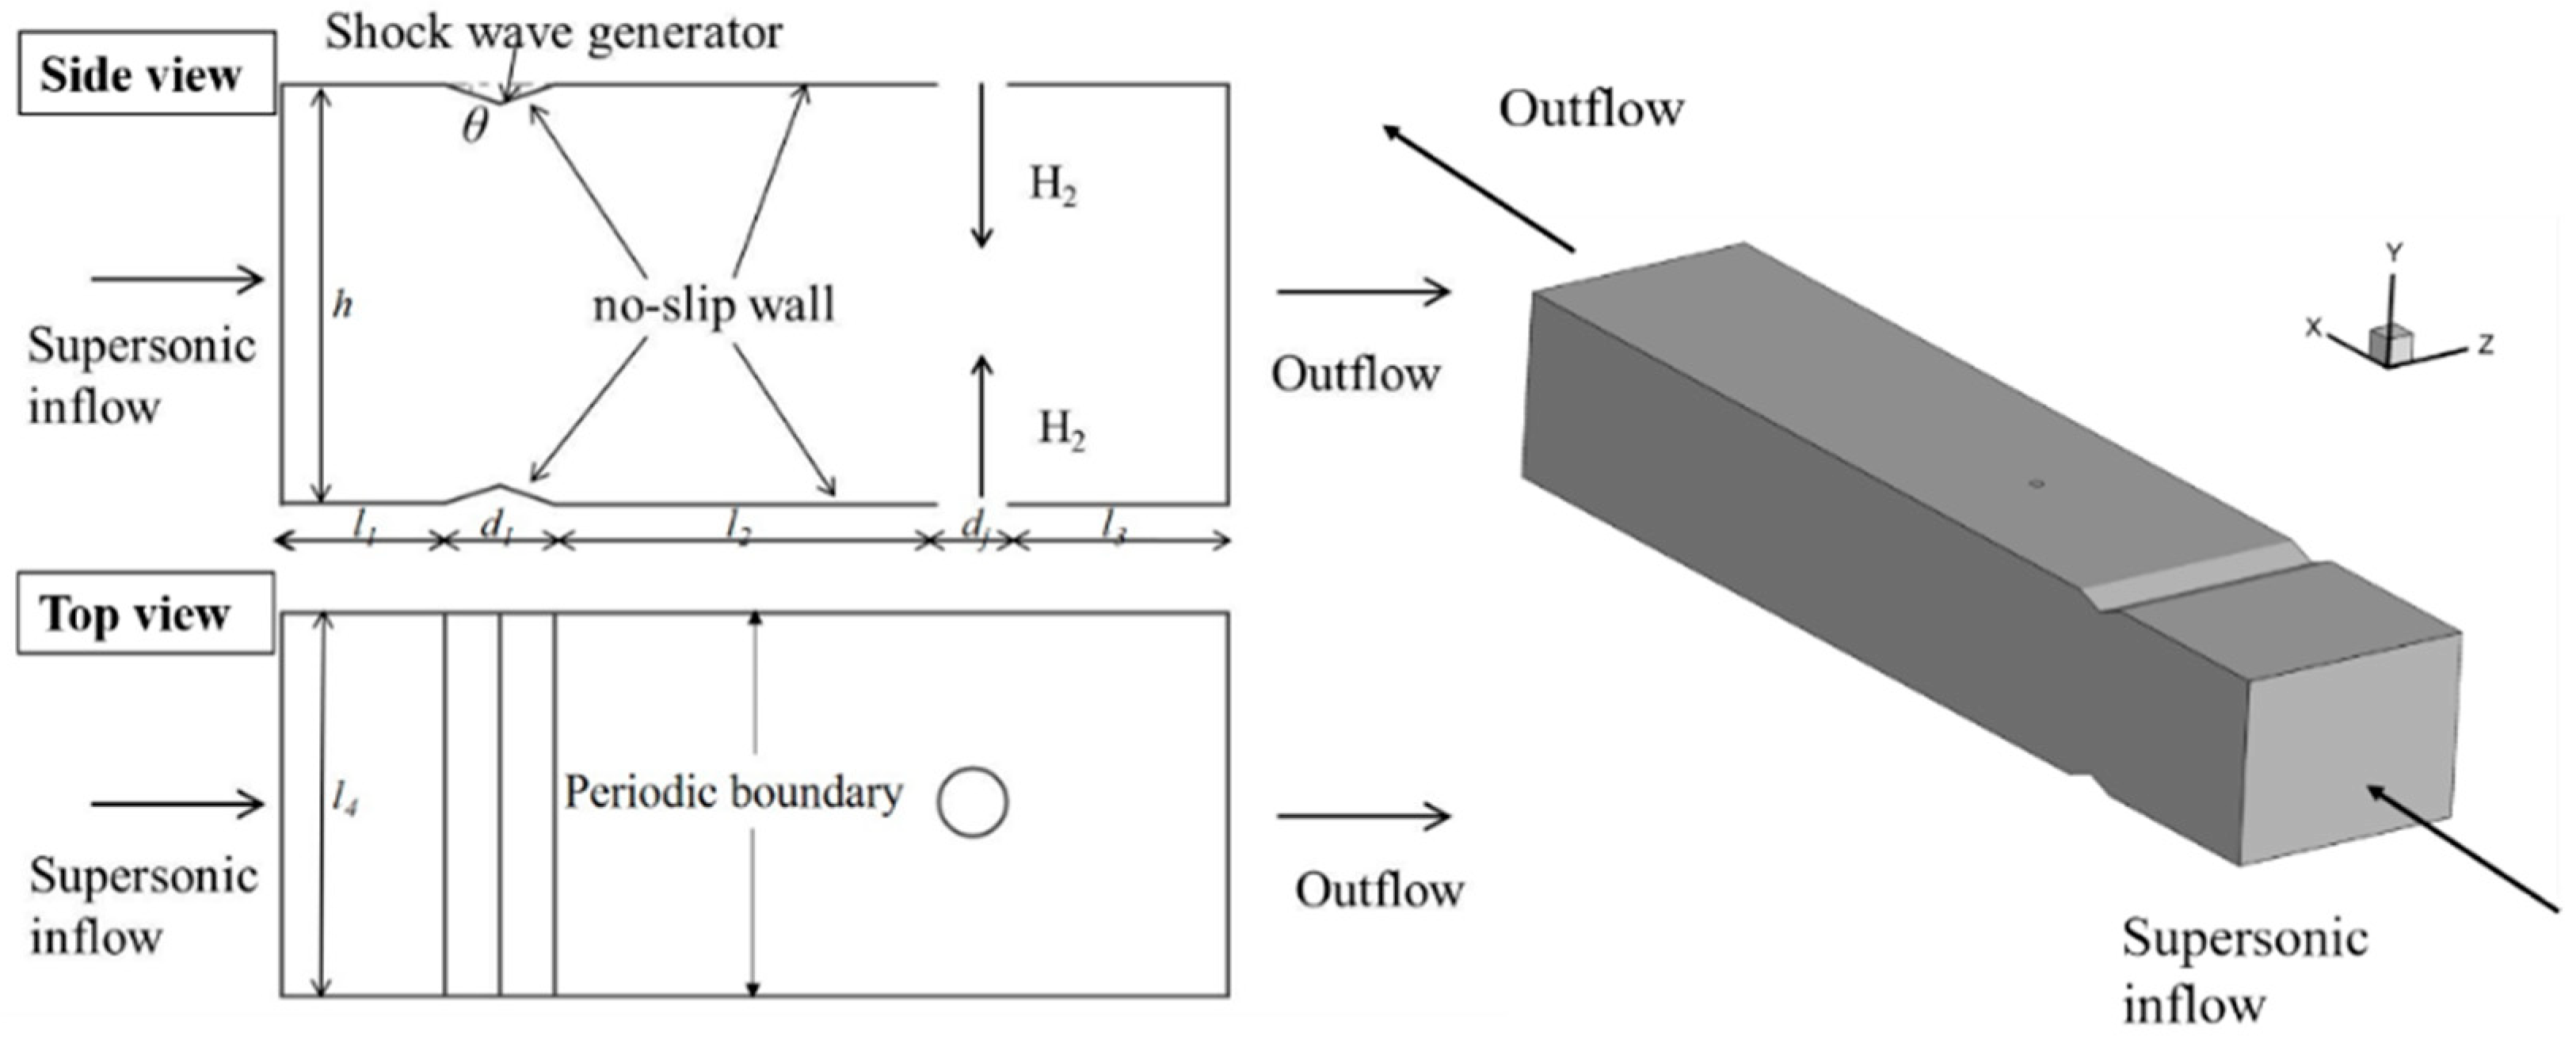
The fuel counter-flow jet can strengthen the bow shock on the windward side of the jet, enhance the convection effect of the flow field, and improve the mixing efficiency of the transverse jet. Moreover, some achievements in ignition and combustion have been made in the research of counter-flow jets combined with the cavity applied to the scramjet combustor. As for the research on fuel counter-flow jet, Yang et al. [19] combined numerical and experimental approaches to investigate the quasi-steady flame characteristics of supersonic combustion in tandem and parallel dual-cavity, comparing the flame structure and other flow field features of two configurations qualitatively and quantitatively. Given the same fuel equivalence ratio, the parallel dual-cavity with the two opposite injections gathered the major combustion around the cavities, thus leading to the concentrated heat release, the greatly extended recirculation zones, and the converging-diverging core flow path. At the same time, intermittent stray flame packets could be found in the downstream zone. Significant reactions were present near the jet exit upstream of the cavity leading edge for the parallel dual-cavity under the given condition. Wang et al. [20] utilized large eddy simulation (LES) to investigate a hydrogen-fueled scramjet combustor with a dual cavity, where a Reynolds-Averaged Navier–Stokes (RANS) model was used for near-wall treatment. The schematic of the computational combustor is shown in Figure 2. He found that the intersection of the bow shock waves and the concentrated heat release generated a high-pressure zone between the cavities, which induced tremendous pressure gradients and evident flows in the transverse direction, pushing the fuel jets towards the combustor walls. Zhong et al. [21] experimentally investigated the combustion characteristics in a supersonic combustor with ethylene injection upstream of dual parallel cavities in a direct-connected test rig. Two clusters of separated and asymmetric flames were found to be stabilized near the dual parallel cavities in all tests.
According to the above discussion, the induced oblique shock and generating shock/shear layer interaction is beneficial to the fuel mixing augmentation in the supersonic flow. There have been relevant achievements in the field of fuel counter-flow jets, but most of them focus on ignition and combustion, and there are gaps in the field of fuel mixing augmentation, which need to be filled urgently. In order to improve the fuel mixing efficiency and lay a foundation for subsequent ignition and combustion, it is necessary to investigate fuel counter-flow jet mixing augmentation. Therefore, in this research, the effect of the shock/jet shear layer on the fuel counter-flow jet was studied. By numerical simulation, the counter-flow jet flow field structure and the characteristic parameters of mixing evaluation were obtained. The mixing augmentation effect of the shock/jet shear layer interaction on the counter-flow jet flow field was studied. The Section 2 briefly introduces the physical model and the numerical method. The Section 3 discusses the flow field structure, hydrogen distribution, vortex structure, mixing parameter analysis, and mixing enhancement scheme decision. The fourth part is the main conclusions of this research.
2. Physical Model and Numerical Method
2.1. Physical Model
According to the experimental conditions and wind tunnel parameters of Wang et al. [22], the wind tunnel was designed as Ma = 3.0, the total inflow pressure was 1ATM, and the total temperature was 300 K. Due to processing and assembly errors, the actual inflow Mach number was obtained as Ma = 2.95 after correction. The boundary conditions of the inflow are shown in Table 1.
In this research, the jet fuel is hydrogen, and the diameter of the fuel jet orifice is 2 mm. The total temperature of the jet fuel is 300 K, which is injected at the speed of sound. Through experiments, it was found that the jet-to-crossflow momentum ratio had an important influence on the flow field structure [23], which is defined as:
where is the density of the gas, U is the flow velocity of the gas, P is the static pressure of the gas, Ma is the Mach number of the gas, γ is the specific heat ratio of the gas, subscript represents the inflow condition, and subscript j represents the fuel jet parameters. According to the definition of the jet-to-crossflow momentum ratio and the setting of the incoming flow parameters, the fuel jet flow parameter conditions are determined as shown in Table 2, and the jet-to-crossflow momentum ratio J = 1.2.
According to the inflow and fuel jet conditions, the model of the hydrogen counter-flow jet with the symmetric setting of SWGs is taken as an example, and the schematic diagram is shown in Figure 3. The diameter of the fuel jet orifice, dj, is 2 mm, and the height of the combustor, h, is 15 dj, which is 30 mm. The center of the jet orifice on the lower wall is selected as the origin of coordinates. In the direction x of flow, the lengths are set as l1, l2, l3, and d1, respectively, which correspond to the position of the SWG, the induced shock acting segment, and the flow field behind the fuel jet orifice and the length of the SWG. l1 and l2 can be obtained from the setting condition and oblique shock relational calculation. l3 is set as 50 dj, which is 100 mm, d1 is set as 5 dj, which is 10 mm, and the angle of the SWG is θ. In the spanwise z direction, the compute domain l4 is set to 20 dj, which is 40 mm. Figure 4 is a schematic diagram of the grid. The grid is generated by software ICEM, which adopts a structured grid. In order to ensure the accuracy of numerical simulation, y+ is set at about 1. The grid is refined near the wall, the jet orifice, and both sides of the SWGs. The height of the first layer of the wall grid is 0.005 mm. The height of the first layer grid on both sides of the SWGs is 0.01 mm.
As for the induced shock wave, the mixing augmentation strategy of the fuel counter-flow jet was studied, and the working cases were set, as shown in Table 3.
2.2. Numerical Method and Verification
This research used the three-dimensional Reynold-Average Navier-Stokes (RANS) equations and the two-equation SST K -ω turbulence model to numerically simulate the jet flow field [24]. The density-based (coupled) double precision solver of FLUENT was used to solve the RANS equation. The second order spatial exact upwind scheme (SOU) and advection upstream splitting method (AUSM) for flux vector splitting accelerate the convergence speed, keeping the Courant-Friedrichs-Levy (CFL) number of 0.5 with appropriate relaxation factors to ensure stability [25]. Air was assumed to be a thermally and calorically perfect gas, and its specific heat ratio γ is 1.4 [26,27]. At the same time, the mass-weighed-mixing law of viscosity was adopted [28]. All of the walls were assumed to have the no-slip condition, while at the outflow, all of the physical variables were extrapolated from the internal cells because the flow is supersonic. When the residual decreases by more than three orders of magnitude and reaches the minimum value, the calculated inflow and outflow mass fluxes drop below 0.001 kg/s, and the solution can be considered convergent [29].
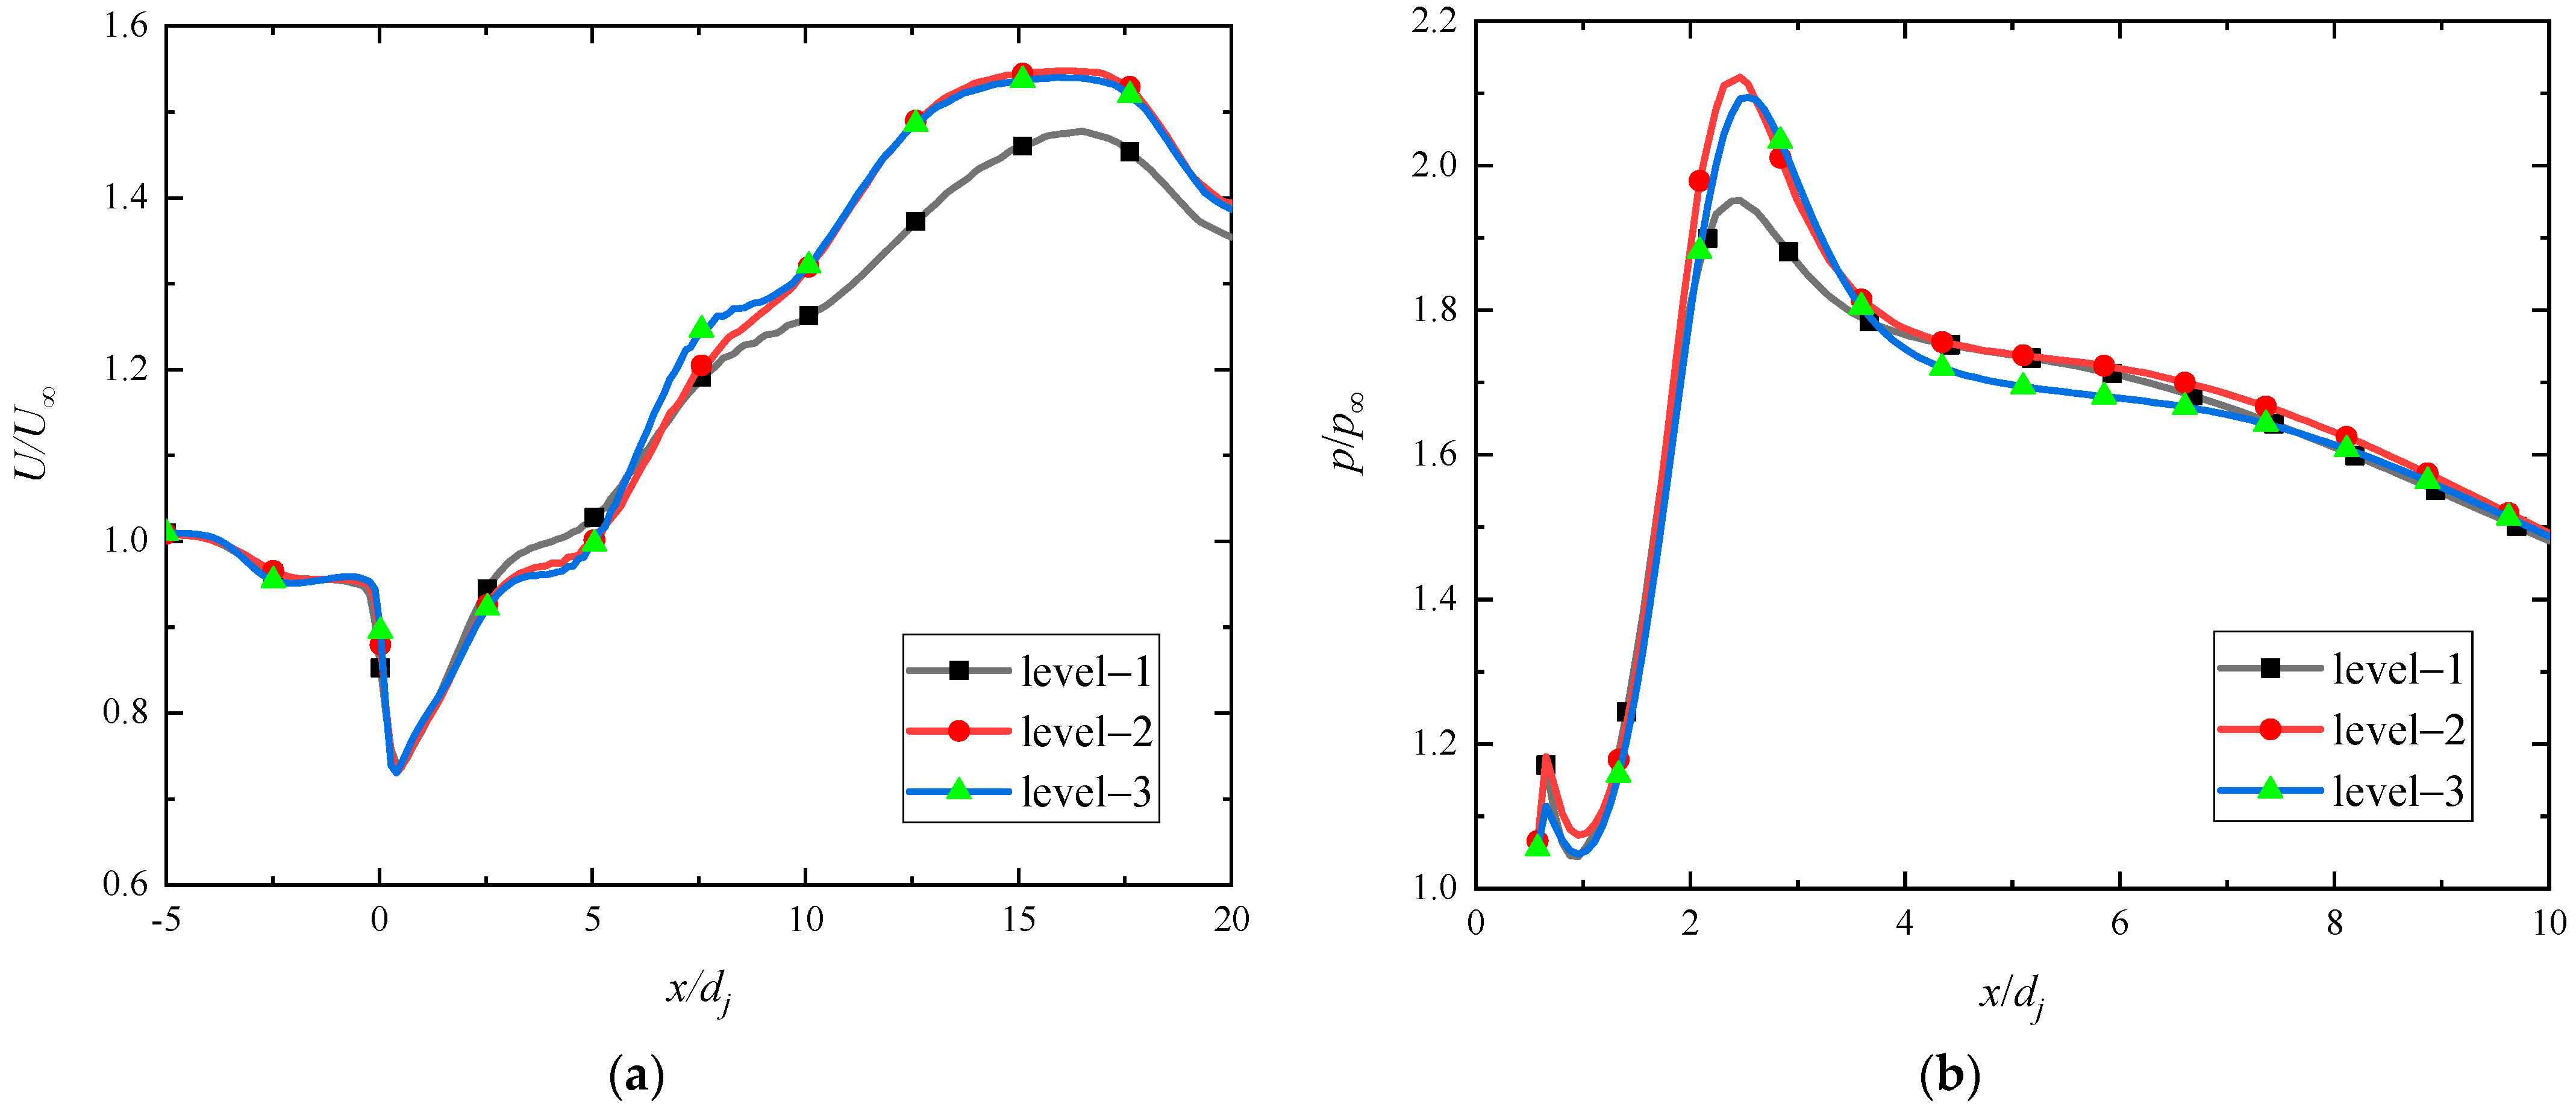
Three sets of grids with different amounts were carried out for grid independence verification to reduce calculation, as shown in Table 4. The normalized velocity results in the x direction and the wall pressure near the fuel jet orifice are verified, as shown in Figure 5. It can be seen from the figure that the calculation accuracy can be achieved by selecting the level-2 grid level.
3. Results and Discussion
3.1. Flow Field Characteristics Analysis
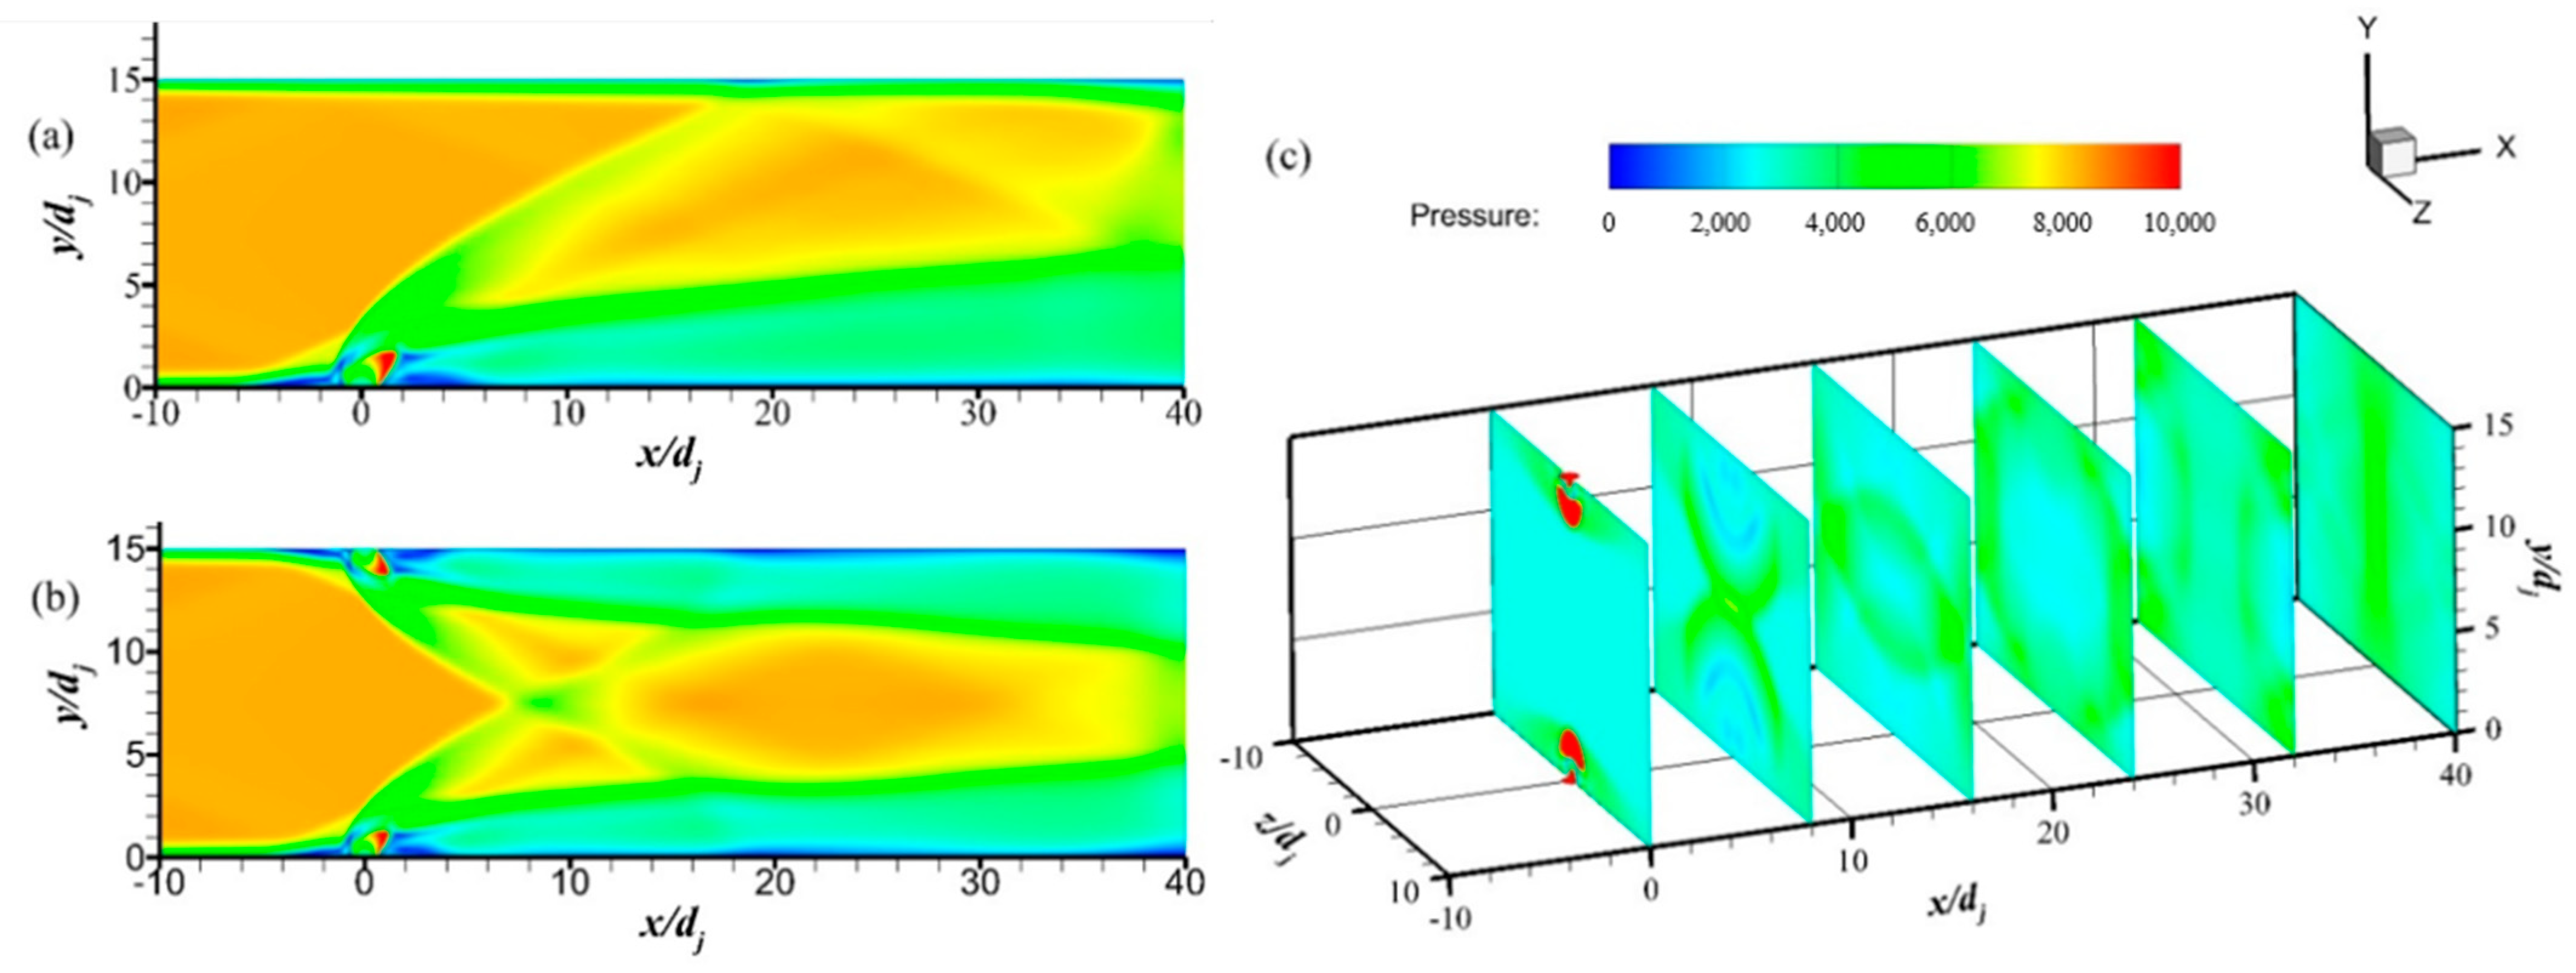
As for the flow field of Case1 and Case 2, the Mach number contours of z = 0 single jet and counter-flow jet are compared in Figure 6. In Figure 6a, the bow shock formed on the windward side of the fuel jet due to jet obstruction, forming reflected shock waves on the upper wall interacting with downstream. In Figure 6b, both the upper and lower jets form bow shock waves on the windward side. Two oblique shock waves were generated at the intersection point and then reflected downstream on the upper and lower walls. The total mass flow rate of the single orifice jet is the same as that of the counter-flow jet. The position of the bow shock generated in Case1 interacting on the upper wall was the same as that in Case2, which was around x/dj = 20. In Figure 6c, at x/dj = 8, the upper and lower groups of bow shocks intersect and spread downstream.
The vicinity of the hydrogen jet orifice in Case2 was studied, as shown in Figure 7. In Figure 7a, due to the interaction of the fuel jet with supersonic inflow, the bow shocks, forming on the windward side of the jet, intersect at M and generate shock waves MN and MP, acting on the downstream. The bow shock waves interact with the boundary layer in front of the jet orifice. There is a zone of high pressure after the shock. An adverse pressure gradient is formed in the upstream zone of the jet orifice, which leads to the boundary layer separation. Then, the separation shock wave forms while the recirculation zone generates. The boundary layer separation zone upstream of the jet forms the horseshoe vortex zone, which can strengthen the mixing of inflow and fuel. After leaving the jet orifice, the under-expanded jet starts the approximatively isentropic expansion and interacts with supersonic crossflow, forming a barrel shock and Mach disk. In the front of the jet, the adverse pressure gradient caused by the fuel jet leads to a recirculation zone. Near the downstream zone of the jet, there is a region of low pressure, forming a flow separation zone and a recirculation zone, resulting in the ignition to maintain. The black curve in Figure 7b is an isoline with flow velocity Vx of 0, and the main recirculation zones are concentrated around the curve, which is reflected in the upstream, front of the jet, and downstream of the jet.
In Case3, the SWG was installed on the upper wall, and its induced shock wave mainly interacted with the hydrogen jet orifice on the lower wall. A series of expansion wave fans were generated at the top of the SWG and acted on the downstream, and intersected with the bow shock generated by the upper and lower wall jet, respectively. The Mach number increases after the expansion wave, as shown in Figure 8a. In Figure 8b, the fuel jet on the lower wall of the counter-flow jet deflects downward due to induced shock waves, and the fuel plume becomes more adherent to the wall. There is a significant uplift of hydrogen flow downstream.
The under-expanded fuel injected from the orifice spreads rapidly. Due to the k-H instability and the interaction between the jet and the inflow, there is a disturbance in the shear layer of the jet, resulting in the counter-rotating vortex pair (CVP) entraining the fluid around the CVP into the plume. The fluid around the CVP is mixed rapidly by shearing action during the enrolling process. Figure 9 shows the pressure contour of the z = 0 plane and bottom plane from jet orifice to x/dj = 5, the contour of hydrogen mass fraction on x/dj = 5, and the streamline is colored by hydrogen mass fraction. The streamlines due to the induced shock wave appear obvious downfold, the core of the fuel plume is closer to the wall, and self-ignition may occur due to the induced shock wave. The existence of the recirculation zone can provide an area for flame stability. The streamlines colored by the hydrogen mass fraction show the mixing progress of CVP coiling fuel. Hydrogen mass fraction of streamlines flowing to the core zone of CVP decreases obviously for the high mixing speed. In addition, at x/dj = 5, the trailing counter-rotating vortex pairs (TCVP) originate from the bottom boundary layer. Horseshoe vortexes are generated in the upstream recirculation zone and are displayed in Figure 9.
In Case4, the SWG is set symmetrically to induce shock waves to intersect in front of the fuel jet, generating waves. Figure 10a,b show the Mach number contour and hydrogen mass fraction contour of the axial plane (Z = 0) of Case4. In Figure 10c, streamlines are colored with velocity in the x direction, and the movement in the flow direction is shown. The wall surface is colored with temperature. The progress of unfolding and downfolding of inflow is shown due to induced shock wave, as well as the acceleration and deceleration of inflow due to shock wave and expansion wave action.
3.2. Fuel Distribution and Vortex Structure Analysis
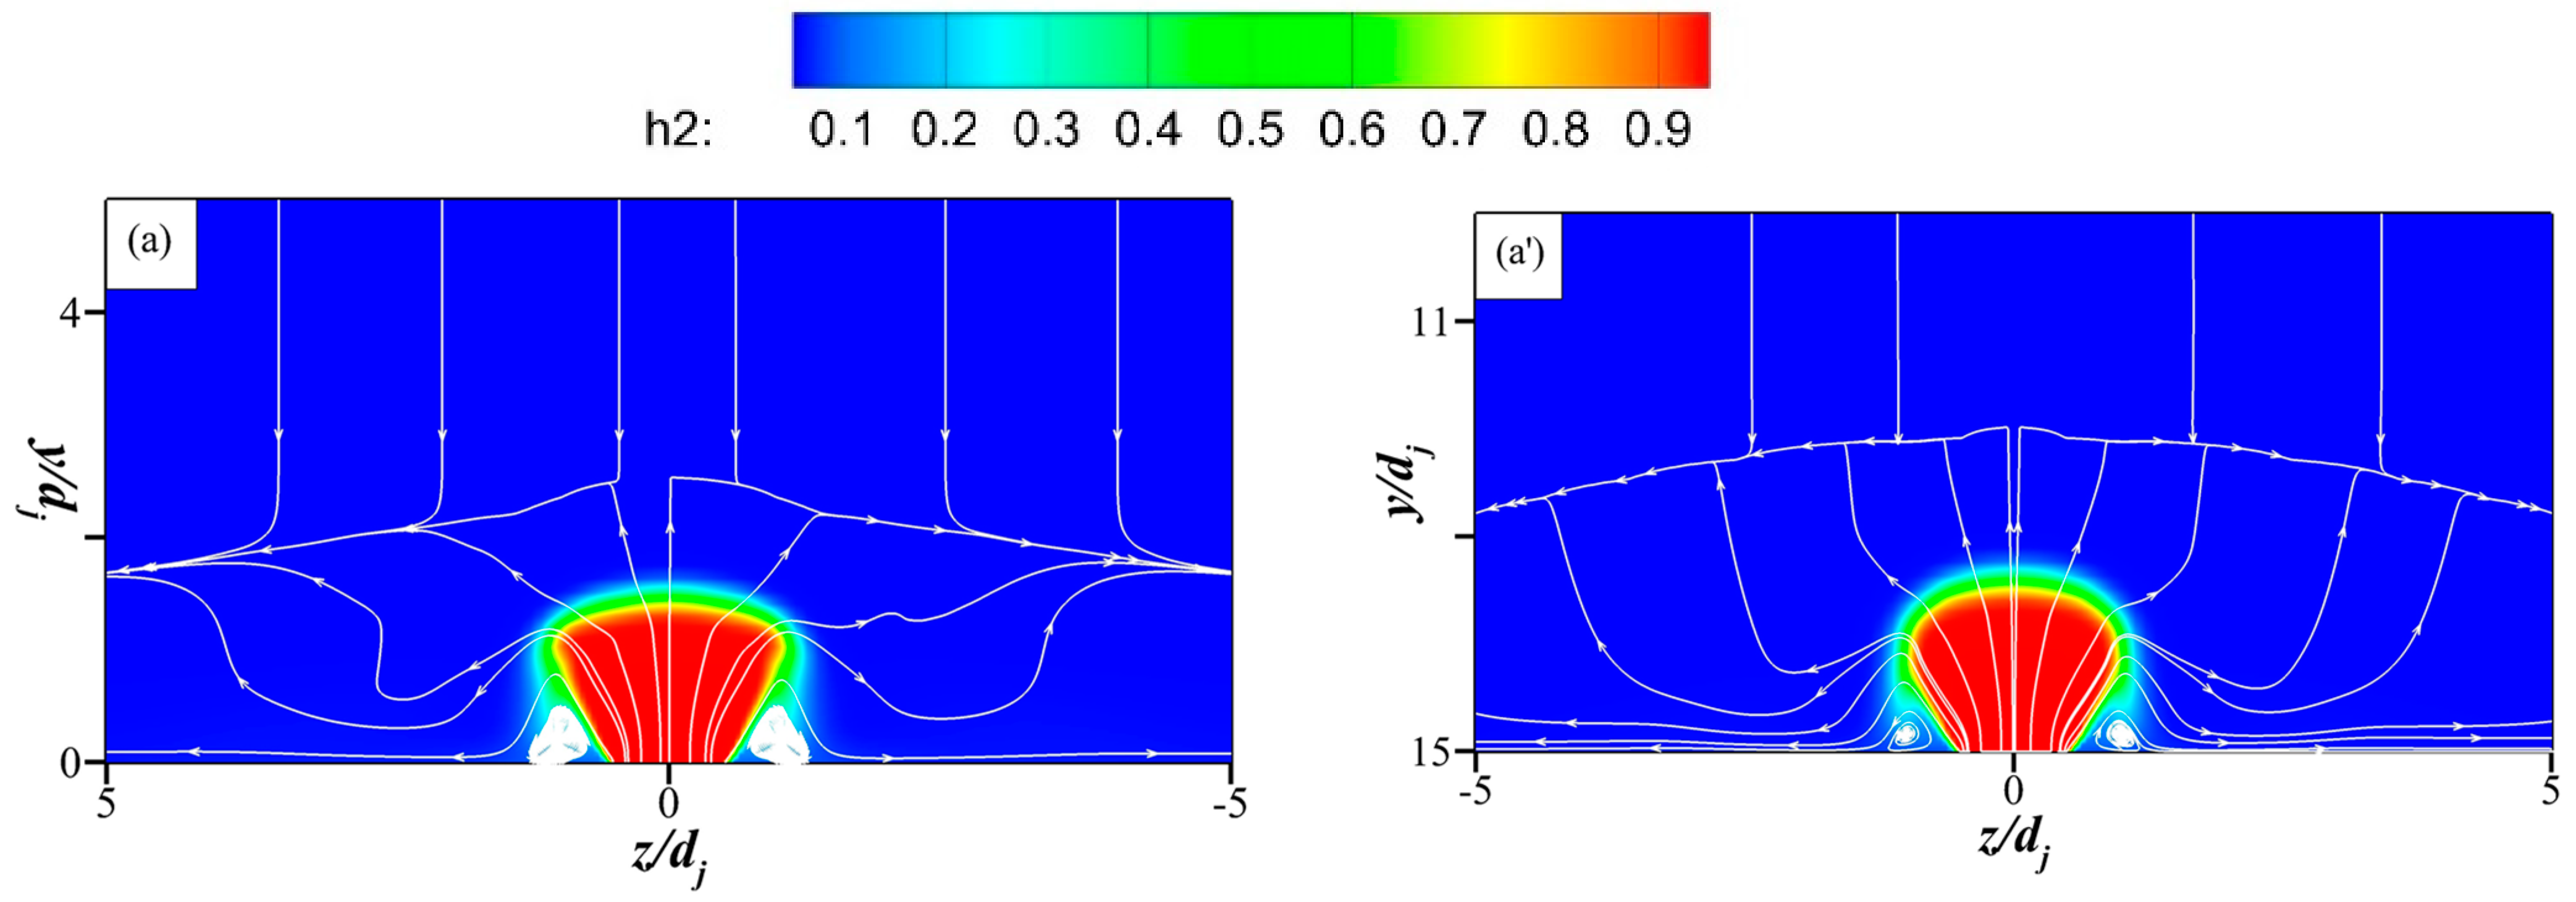
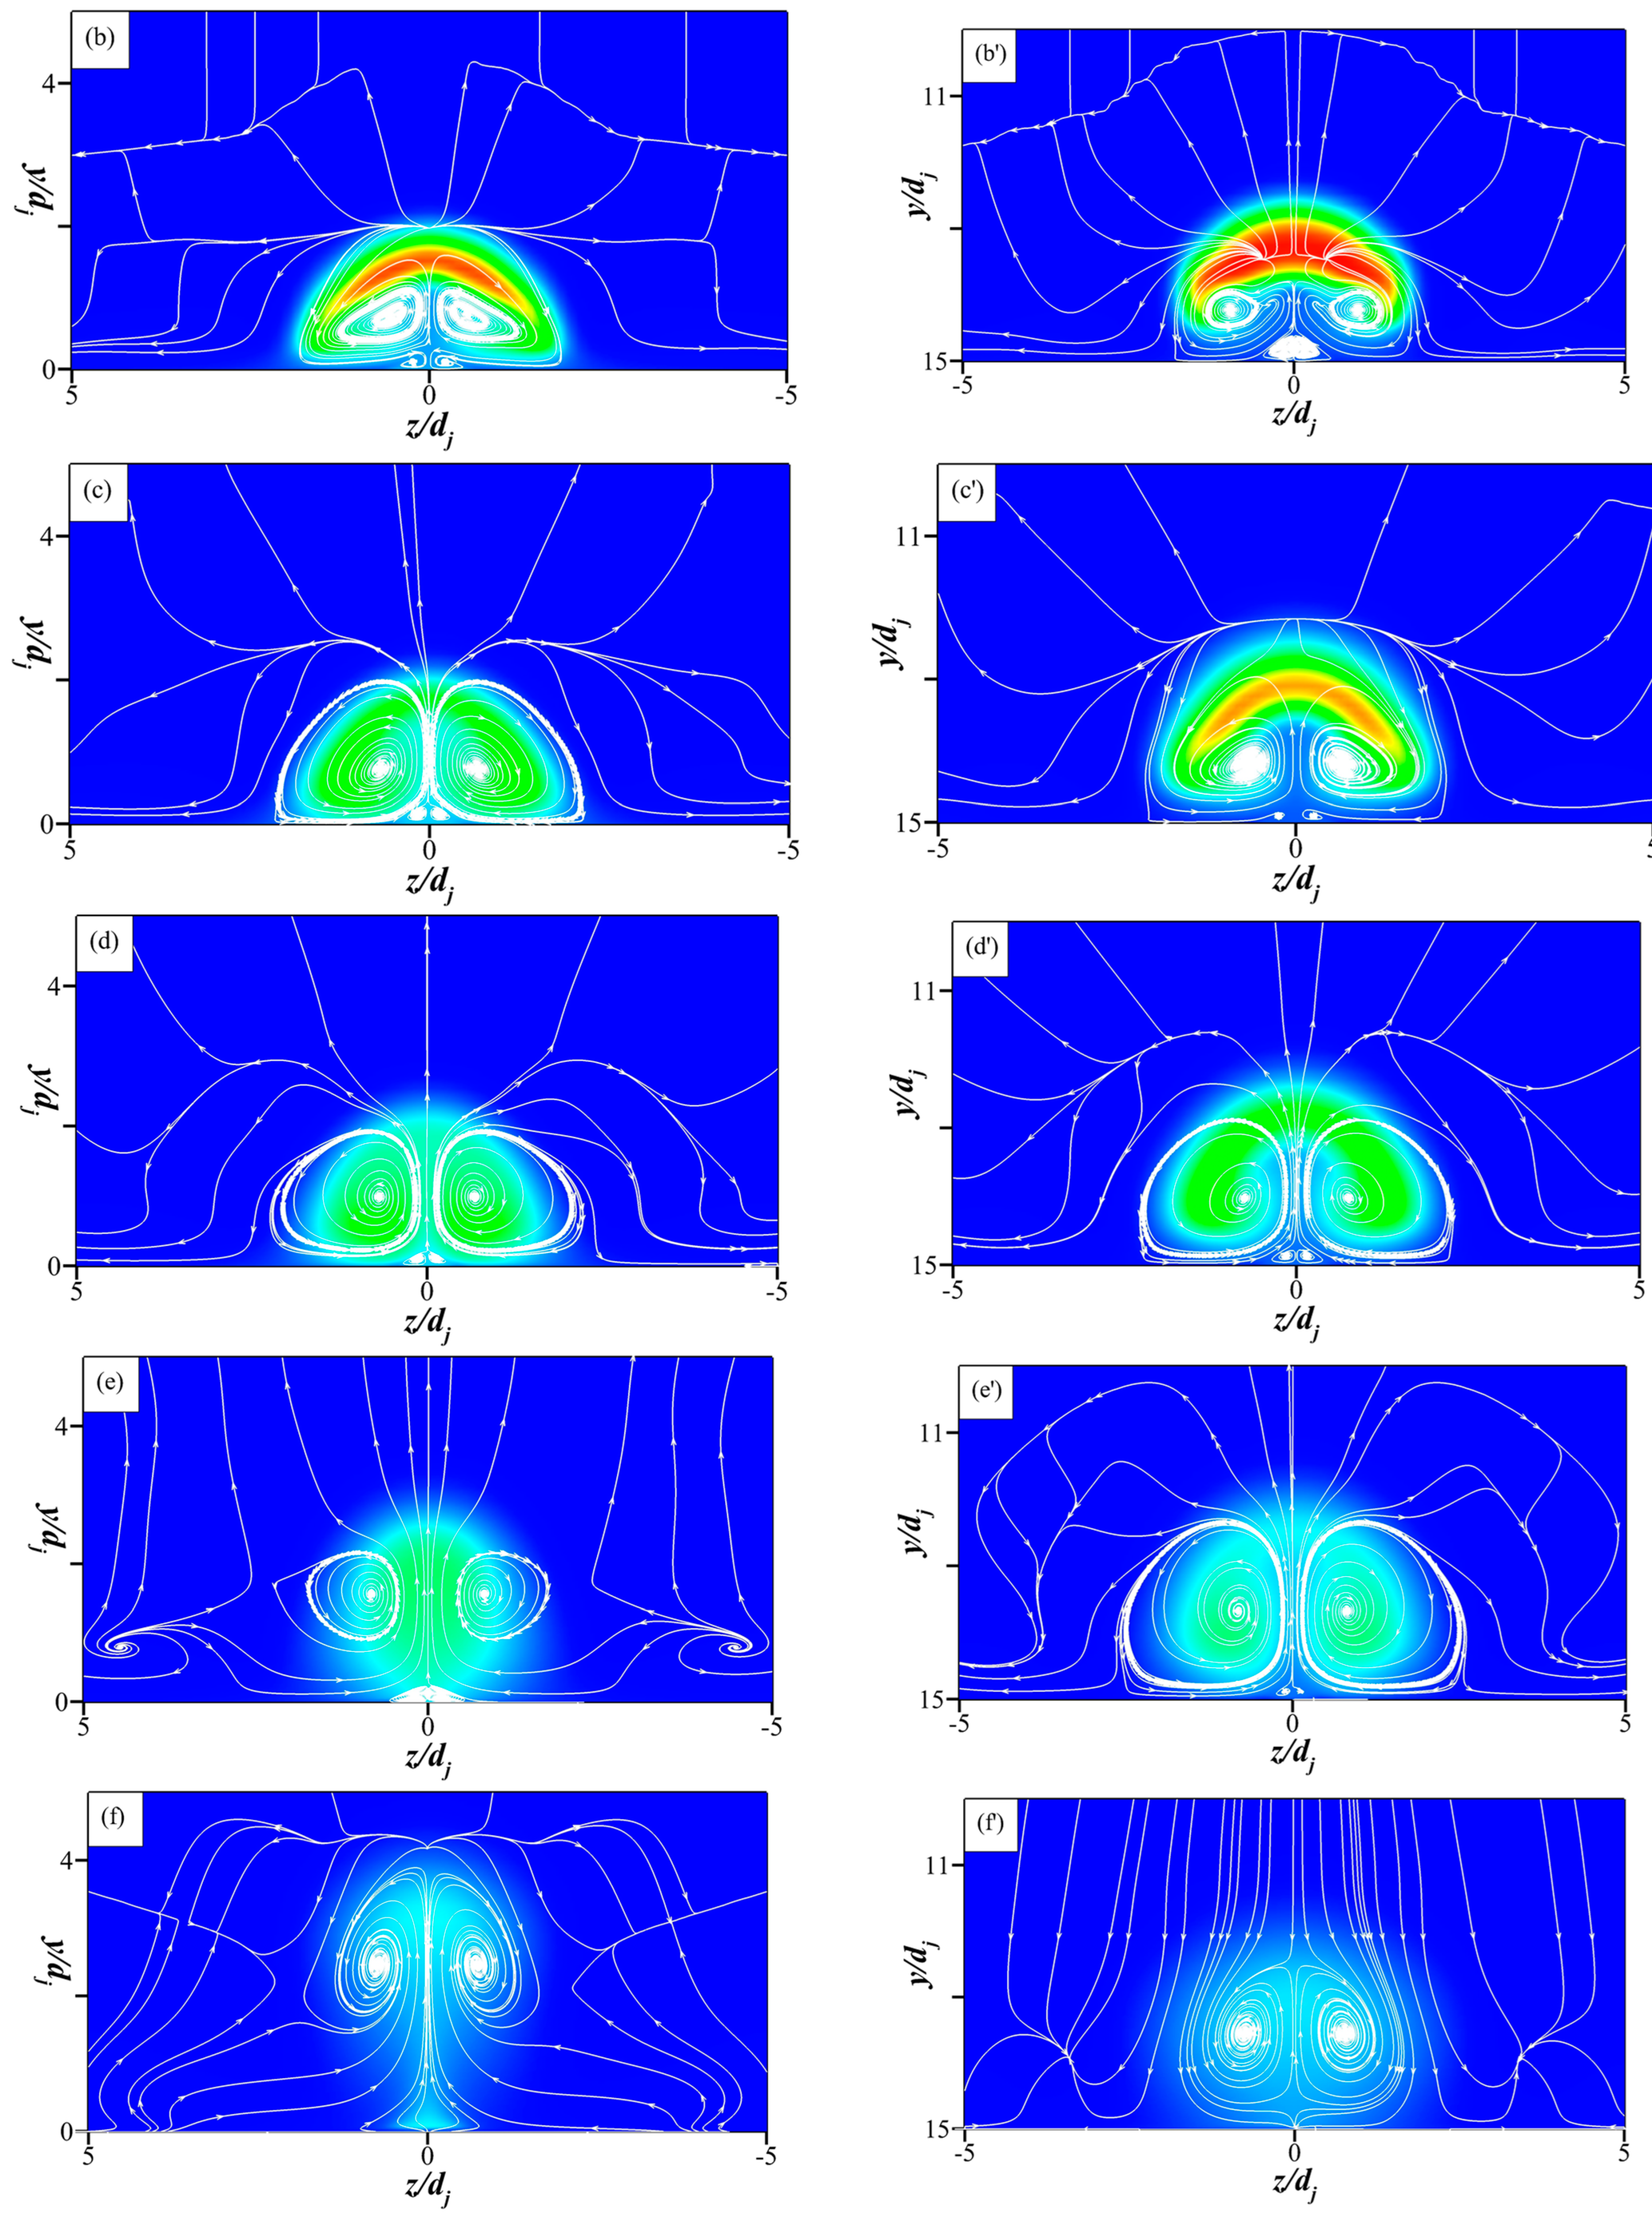
Figure 11 shows the spatial distribution of hydrogen in the flow field of Case3. In Figure 11a,a′, fuel is injected into the flow field through the injection orifice. The hydrogen concentration is high in the fuel core area, and the horseshoe vortex structure appears on both sides of the bottom of the fuel core. In Figure 11b,b′, the CVP structure has been formed, mainly under the fuel core, and the CVP drives the mixing of fuel and inflow. TCVP appears below the CVP structure, while there is less fuel distribution in the middle zone of CVP, and the fuel is confined to the CVP region. The Structure of CVP gradually expands and develops in an extensional direction, absorbing incoming flow in a larger area for mixing in Figure 11c,d,c′,d′. Figure 11e,e′,f,f′ show significant differences, mainly in the effect of induced shock waves on fuel jets. By comparing the left and right columns in Figure 11, the core of the hydrogen plume is lower due to the induced shock wave, and the area of hydrogen mass fraction above 0.7 is significantly reduced. In the spreading direction, the horseshoe vortex structure can be found at x/dj = 5, closer to the fuel center region, but it does not penetrate the fuel core region, so it has little effect on the mixing process [30].
In Case4, Q criterion iso-surface of 1.0 and x direction vorticity of each section, as shown in Figure 12. Near x/dj = 0 and x/dj = 23, as shock waves generated by SWG and counter-flow jet act on x/dj = 0 and x/dj = 23, respectively, the distribution of Q criterion iso-surface in the two regions increases significantly in the direction of the spread. In the core region of the jet, the Q criterion iso-surface passes through the region with solid vorticity in the x direction of each section.
As for the impact of the angle of SWG change on hydrogen distribution and vorticity of each section, the flow field data near the lower wall fuel jet in Case3, Case5 and Case7 were extracted, as shown in Figure 13. The left side of the figure is the hydrogen mass fraction diagram, while the right is the x-direction vorticity diagram. With the increase in the angle of SWG, the intensity of the oblique shock wave increases, and the shock/jet shear layer effect becomes more apparent. At x/dj = 0, the horseshoe vortex area increases, and the region with higher vorticity is widely distributed. At x/dj = 5, hydrogen is mainly distributed in the high vorticity region, CVP enrolling and dominating the mixing. At x/dj = 10, the horseshoe vortex develops outward in the spreading direction and gradually moves away from the fuel core region. The distribution of hydrogen core breaks out of the limitation of the CVP structure. At x/dj = 20, the fuel distribution and vortex structure are uplifted with the increase in the angle of SWG.
3.3. Analysis of the Mixing Parameters
In order to quantitatively study the induced shock wave’s influence on the counter-flow jet, the following parameters are selected for in-depth study. The total pressure recovery coefficient is defined as the ratio of total local pressure to inlet total pressure, reflecting the degree of total pressure loss. The larger the total pressure recovery coefficient is, the smaller the total pressure loss is, which is defined as:
where represents the local total pressure and represents the inlet total flow pressure.
The mixing degree of fuel and air is evaluated by the mixing efficiency, which mainly reflects the percentage of the fuel involved in the reaction in the overall fuel. The higher the mixing efficiency is, the better the mixing degree of effect is considered and is defined as:
where, mtotal represents the total mass flow rate of hydrogen of jet fuel, mmix represents the mass rate of hydrogen involved in mixing, α represents the mass fraction of hydrogen of jet fuel, αr represents the mass fraction of hydrogen involved in the reaction, αs represents the chemical equivalent mass fraction of fuel which is 0.0283. The total pressure recovery coefficient and the mixing efficiency of the supersonic transverse jet directly affect the combustion efficiency [31].
In experiments, the fuel penetration depth is usually represented by the upper boundary of the jet, which is considered as the 1% concentration iso-surface of the fuel [32]. Li [29] demonstrated the relationship between the mixing length and fuel concentration: that is, when fuel is mixed with the inflow, its mass fraction drops to 0.5, and its distance in the flow direction can be considered as the mixing length.
The influence on the layout of SWG is shown in Figure 14. Compared with Case2 without SWG, the total pressure recovery coefficient of Case3 with unilateral setting and Case4 with symmetric setting decreased by 9.6% and 19.0%, respectively, at x/dj = 40. Compared with Case2, the mixing efficiency of Case3 and Case4 is improved by 12.3% and 25.8%, respectively, at x/dj = 40. The symmetrical setting of SWG can improve the mixing efficiency.
The impact of the angle of SWG is shown in Figure 15 and Figure 16. Based on the unilateral setting of the SWG, the total pressure recovery coefficients of Case2, Case3, Case5, and Case7 decrease successively after x/dj = −10. At x/dj = 40, the total pressure recovery coefficients of Case5, Case3, and Case7 decrease 3.4%, 9.7% and 16.5%, respectively, compared with Case2. In terms of mixing efficiency, the opposite conclusion is presented. At x/dj = 40, the mixing efficiency of Case5, Case3, and Case7 is 3.9%, 12.3%, and 30.0% higher than that of Case2, respectively.
Based on the symmetric setting of the SWG, the total pressure recovery coefficients of Case6, Case4, and Case8 decrease by 5.7%, 23.4%, and 30.7%, respectively, compared with Case2 at x/dj = 40. In terms of mixing efficiency, at x/dj = 40, the mixing efficiency of Case6, Case4, and Case8 increase by 9.0%, 26.7%, and 56.7%, respectively, compared with Case2. The angle of SWG is between 10 and 30°, and the mixing efficiency increases with the angle increase.
The influence of the shock wave interacting position on the mixing augmentation is in Figure 17. The difference in total pressure recovery coefficients of Case3, Case9, and Case10 are small in terms of total pressure loss. The shock wave interacting position affects the fuel counter-flow jet mixing in terms of mixing efficiency. After the fuel injection orifice, the mixing efficiency of Case9 is significantly higher than that of Case3 and 10. At x/dj = 40, Case9 improves by 16.8% compared with Case3 and 10. The oblique shock wave acts on the front of the jet, influencing the mixing efficiency.
As for the fuel penetration depth, the influence of the angle of SWG and oblique shock position is mainly studied on the data in Case3, Case5, Case7, Case9, and Case10. In terms of fuel penetration depth, the angle of SWG is changed based on the unilateral setting of the SWG. In Figure 18a,b, the penetration depth of Case7 is the largest, and the penetration depth of Case3 and 5 was the same. In Figure 18c,d, the impact of the shock wave interacting position on fuel penetration depth is as follows: at the lower wall surface, the penetration depth of Case10 is the largest before x/dj = 20, while that of Case9 is the largest after x/dj = 20. Case3, Case9, and Case10 are the same near the upper wall. In terms of fuel penetration depth, the change of angle of SWG influences fuel penetration depth.
The coordinates of the furthest point of the mixing length in Case3, Case5, Case7, Case9, and Case10 are shown in Figure 19. The mixing length of the lower wall fuel jet is smaller than that of the upper wall. At the lower wall, the mixing length decreases with the increase in the angle of SWG. In Case3, Case9, and Case10, the mixing length can be effectively shortened when the shock wave interacts near the fuel jet.
3.4. AHP Decision-Making Scheme
By the mixing parameters mentioned above: the total pressure recovery coefficient, mixing, mixing length, and the penetration depth of fuel efficiency, as an evaluation criterion, two mixing augmentation schemes are proposed: the angle of SWG and the position of SWG. To determine the enhancing effect of these two schemes on the mixing, the analytic hierarchy process (AHP) [33] was used to make the optimization decision [34,35].
Firstly, the hierarchical structure was established, and G, the optimal mixing augmentation scheme, was taken as the target layer. C1, the total pressure recovery coefficient, C2, the mixing efficiency, C3, the mixing length, and C4, the penetration depth of fuel, are taken as the main influencing factors of the mixing augmentation scheme as the criterion layer. At the scheme layer, there are two schemes: A1 changing the angle of SWG and A2 changing the position of SWG, as shown in Figure 20.
Secondly, to construct the judgment matrix, it is necessary to give the relative importance of each element at each level to each element at the upper level. In order to facilitate comparison, the judgment matrix is quantified, and the 1–9 scale is introduced based on the experience of scholars [33], as shown in Table 5.
For the mixing augmentation scheme, the total pressure recovery coefficient is determined as the primary objective to achieve the minimum total pressure loss to ensure thrust, mixing efficiency, mixing length to reduce the combustor length, and finally, the penetration depth. The scale values of the mixing augmentation scheme are shown in Table 6.
Thus, the comparison matrix of the target layer and criterion layer is constructed:
Thirdly, the criterion layer is connected with the scheme layer to determine the pairwise comparison matrix of A1 and A2 on the four criteria. In terms of C1, the total pressure recovery coefficient, according to the comparison of the total pressure recovery coefficient in Section 3.3, changing the angle of SWG has a decisive influence on the total pressure recovery coefficient, which is very important compared with changing the position of the shock wave. Therefore, the comparison matrix of A1 and A2 on the C1 criterion is:
In terms of the C2 mixing efficiency, the mixing efficiency can be improved to a certain extent by changing the position of the SWG to change the shock wave interacting position, with the total pressure recovery coefficient unchanged, but the range of improvement is limited. Therefore, the comparison matrix of A1 and A2 on the C2 criterion is determined as follows:
In terms of penetration depth, the fuel jet penetration depth varies significantly when the angle of the SWG is changed, whether on the upper or lower wall. Therefore, it is considered that the changing angle of SWG has a slightly significant influence. In comparing the mixing lengths of fuel jets on the upper and lower wall, Case3, Case5, and Case7 have a significant gap in flow distribution compared with Case3, Case9, and Case10. It can be determined that changing the angle of SWG has a significant relative influence. Therefore, the comparison matrices on C3 and C4 criteria are, respectively:
Fourthly, the following is a single hierarchical sorting and consistency test. Normalized the above judgment matrix:
The relative weight coefficient of G is . According to the weight coefficient vector, the maximum eigenvalue is approximately calculated.
The result shows that the inconsistency of G is within the allowable range. As for judgment matrices B1, B2, B3, and B4, all pass the consistency test through the above process, and their weight coefficient vectors are:
Through the calculation of AHP, the evaluation result of A1 and A2 for the mixing augmentation scheme is . The decision-making outcome is that the A1 scheme is better than the A2. The effect of changing the SWG Angle on the mixing augmentation is better than that of changing the position of SWG.
4. Conclusions
The SWG is installed in the counter-flow jet flow field in this research. As for the three configurations of SWG, whose inclination angle is 10°, 20°, and 30°, and unilateral and symmetrical layout, induced shock wave interacting position, and other influencing factors, the numerical simulation for the counter-flow jet flow field with the induced shock wave is carried out. In the end, the AHP is used to provide an idea of mixing augmentation decision-making scheme, and the following conclusions as follow:
- (1)
- The hydrogen core position of the fuel counter-flow jet is lower near the jet orifice, and the hydrogen flow is uplifted downstream due to the induced shock wave. Moreover, the horseshoe vortex is closer to the fuel region, but it does not penetrate into the fuel core region.
- (2)
- SWG induces shock waves to act on the fuel counter-flow jet. Regarding mixing efficiency, the symmetric setting is better than the unilateral setting and better than the case without induced shock wave.
- (3)
- Due to the impact of the angle of SWG, the mixing efficiency increases with the increase in the angle of SWG, while the total pressure loss is on the contrary. An optimal configuration balances the mixing efficiency and the total pressure loss.
- (4)
- The total pressure recovery coefficient fluctuates little for the effect of the induced shock wave of the interacting position. In terms of the mixing efficiency, the mixing efficiency is the highest when the shock wave acts on the front of the fuel jet, while the mixing efficiency is almost flat when the shock wave acts on the jet and the rear. The mixing efficiency is the same at the place far from the jet, regardless of the shock wave interacting position.
- (5)
- By comparing the two schemes of changing the angle of SWG and changing the position of SWG by the analytic hierarchy process (AHP), it is concluded that changing the angle of SWG to carry out the mixing augmentation effect is better.
Author Contributions
Conceptualization, C.S.; methodology, C.S.; software, Z.D.; validation, Y.H.; formal analysis, Y.H.; resources, Z.D.; data curation, H.T.; writing—original draft preparation, Y.H.; writing—review and editing, Y.H.; visualization, Y.H. All authors have read and agreed to the published version of the manuscript.
Funding
This research was funded by the National Natural Science Foundation of China grant number No.12072367, Natural Science Foundation of Hunan Province grant number No. 2020JJ4666 and Graduate Research and Innovation Projects of Hunan Province grant number No. CX20210023.
Institutional Review Board Statement
Not applicable.
Informed Consent Statement
Not applicable.
Data Availability Statement
Not applicable.
Conflicts of Interest
The authors declare no conflict of interest.
References
- Lewis, M. X-51 scrams into the future, University of Maryland. Aerosp. Am. 2010, 48, 26–31. [Google Scholar]
- Rosenberg, Z. X-51 programme ends on high note. Flight Int. 2013, 183, 29. [Google Scholar]
- Choi, Y.; Yost, M.F.; Lerner, E.W.; Driscoll, J.F. Scramjet Performance Computed for a JP-7-Fueled Generic X-51 Vehicle. J. Propuls. Power 2022, 38, 348–358. [Google Scholar] [CrossRef]
- Seiner, J.M.; Dash, S.M.; Kenzakowski, D.C. Historical Survey on Enhanced Mixing in Scramjet Engines. J. Propuls. Power 2001, 17, 1273–1286. [Google Scholar] [CrossRef]
- Huang, W. Transverse jet in supersonic crossflows. Aerosp. Sci. Technol. 2016, 50, 183–195. [Google Scholar] [CrossRef]
- Urzay, J. Supersonic Combustion in Air-Breathing Propulsion Systems for Hypersonic Flight. Annu. Rev. Fluid Mech. 2018, 50, 593–627. [Google Scholar] [CrossRef]
- Du, Z.-B.; Shen, C.-B.; Huang, W.; Han, Y. Investigation on the impact of the induced shock wave on the hydrogen mixing augmentation in a supersonic crossflow: A numerical study. Fuel 2021, 312, 122961. [Google Scholar] [CrossRef]
- Etheridge, S.; Lee, J.G.; Carter, C.; Hagenmaier, M. Characterization of Supersonic Flow Interaction with a Shockwave Using Laser-based Diagnostics. In Proceedings of the 48th AIAA/ASME/SAE/ASEE Joint Propulsion Conference Exhibit, Atlanta, Georgia, 30 July–1 August 2012. [Google Scholar]
- Huang, W.; Wang, Z.-G.; Wu, J.-P.; Li, S.-B. Numerical prediction on the interaction between the incident shock wave and the transverse slot injection in supersonic flows. Aerosp. Sci. Technol. 2013, 28, 91–99. [Google Scholar] [CrossRef]
- Shekarian, A.A.; Tabejamaat, S.; Shoraka, Y. Effects of incident shock wave on mixing and flame holding of hydrogen in supersonic air flow. Int. J. Hydrogen Energy 2014, 39, 10284–10292. [Google Scholar] [CrossRef]
- Tahsini, A.M.; Mousavi, S.T. Investigating the supersonic combustion efficiency for the jet-in-cross-flow. Int. J. Hydrogen Energy 2015, 40, 3091–3097. [Google Scholar] [CrossRef]
- Zhao, M.; Li, Q.; Ye, T. Investigation of the mixing characteristics in a transverse hydrogen injection combustor with an inlet compression ramp. Acta Astronaut. 2019, 160, 479–488. [Google Scholar] [CrossRef]
- Li, Z.; Manh, T.D.; Gerdroodbary, M.B.; Nam, N.D.; Moradi, R.; Babazadeh, H. The influence of the wedge shock generator on the vortex structure within the trapezoidal cavity at supersonic flow. Aerosp. Sci. Technol. 2020, 98, 105695. [Google Scholar] [CrossRef]
- Huang, W.; Wu, H.; Du, Z.-B.; Yan, L.; Choubey, G. Design exploration on the mixing augmentation induced by the oblique shock wave and a novel step in a supersonic flow. Acta Astronaut. 2021, 180, 622–629. [Google Scholar] [CrossRef]
- Zuo, Q.R.; Yu, H.L.; Dai, J. Effects of cavity-induced mixing enhancement under oblique shock wave interference: Numerical study. Int. J. Hydrogen Energy 2021, 46, 35706–35717. [Google Scholar]
- An, B.; Sun, M.B.; Wang, Z.; Chen, J. Flame stabilization enhancement in a strut-based supersonic combustor by shock wave generators. Aerosp. Sci. Technol. 2020, 104, 105942. [Google Scholar] [CrossRef]
- Liu, C.; Wang, Z.; Wang, H.; Sun, M. Numerical investigation on mixing and combustion of transverse hydrogen jet in a high-enthalpy supersonic crossflow. Acta Astronaut. 2015, 116, 93–105. [Google Scholar] [CrossRef]
- Liu, C.; Yu, J.; Wang, Z.; Sun, M.; Wang, H.; Grosshans, H. Characteristics of hydrogen jet combustion in a high-enthalpy supersonic crossflow. Phys. Fluids 2019, 31, 4. [Google Scholar] [CrossRef]
- Yang, Y.; Wang, Z.G.; Sun, M.B.; Wang, H.B.; Li, L. Numerical and experimental study on flame structure characteristics in a supersonic combustor with dual-cavity. Acta Astronaut. 2015, 117, 376–389. [Google Scholar] [CrossRef]
- Wang, H.; Wang, Z.; Sun, M.; Qin, N. Large eddy simulation of a hydrogen-fueled scramjet combustor with dual cavity. Acta Astronaut. 2015, 108, 119–128. [Google Scholar] [CrossRef]
- Zhong, Z.; Wang, Z.G.; Sun, M.B.; Wang, H.B. Combustion characteristics in a supersonic combustor with ethylene injection upstream of dual parallel cavities. Proc. Inst. Mech. Eng. Part G J. Aerosp. Eng. 2016, 230, 2515–2522. [Google Scholar] [CrossRef]
- Wang, Q.; Wang, Z.; Zhao, Y. On the impact of adverse pressure gradient on the supersonic turbulent boundary layer. Phys. Fluids 2016, 28, 116101. [Google Scholar] [CrossRef]
- Zukoski, E.E.; Spaid, F.W. Secondary injection of gases into a supersonic flow. AIAA J. 1964, 2, 1689–1696. [Google Scholar] [CrossRef]
- Huang, W.; Liu, W.; Li, S.; Xia, Z.; Liu, J.; Wang, Z. Influences of the turbulence model and the slot width on the transverse slot injection flow field in supersonic flows. Acta Astronaut. 2012, 73, 1–9. [Google Scholar] [CrossRef]
- Huang, W.; Li, S.; Yan, L.; Wang, Z. Performance evaluation and parametric analysis on cantilevered ramp injector in supersonic flows. Acta Astronaut. 2013, 84, 141–152. [Google Scholar] [CrossRef]
- Li, L.-Q.; Huang, W.; Fang, M.; Shi, Y.-L.; Li, Z.-H.; Peng, A.-P. Investigation on three mixing enhancement strategies in transverse gaseous injection flow fields: A numerical study. Int. J. Heat Mass Transf. 2019, 132, 484–497. [Google Scholar] [CrossRef]
- Kummitha, O.R.; Suneetha, L.; Pandey, K. Numerical analysis of scramjet combustor with innovative strut and fuel injection techniques. Int. J. Hydrogen Energy 2017, 42, 10524–10535. [Google Scholar] [CrossRef]
- Kummitha, O.R. Numerical analysis of hydrogen fuel scramjet combustor with turbulence development inserts and with different turbulence models. Int. J. Hydrogen Energy 2017, 42, 6360–6368. [Google Scholar] [CrossRef]
- Li, L.-Q.; Huang, W.; Yan, L.; Li, S.-B. Parametric effect on the mixing of the combination of a hydrogen porthole with an air porthole in transverse gaseous injection flow fields. Acta Astronaut. 2017, 139, 435–448. [Google Scholar] [CrossRef]
- Génin, F.; Menon, S. Dynamics of sonic jet injection into supersonic crossflow. J. Turbul. 2010, 11, 1–30. [Google Scholar] [CrossRef]
- Aso, S.; Inoue, K.; Yamaguchi, K.; Tani, Y. A study on supersonic mixing by circular nozzle with various injection angles for air breathing engine. Acta Astronaut. 2009, 65, 687–695. [Google Scholar] [CrossRef]
- Browna, G.L.; Roshkoa, A. On density effects and large structure in turbulent mixing layers. J. Fluid Mech. 1974, 64, 775–816. [Google Scholar] [CrossRef] [Green Version]
- Mu, E.; Pereyra-Rojas, M. Understanding the analytic hierarchy process. In Practical Decision Making; Springer: Cham, Switzerland, 2017; pp. 7–22. [Google Scholar]
- Tzeng, G.H.; Huang, J.J. Multiple Attribute Decision Making; CRC Press: Boca Raton, FL, USA, 2011. [Google Scholar]
- Silvia, C.; Masahiro, I.; Václav, K.; Miroslav, P. Multi-criteria decision analysis without consistency in pairwise comparisons. Comput. Ind. Eng. 2022, 168, 108089. [Google Scholar]
Figure 1.
Flow field structure of the shock wave/jet shear layer interaction for transverse injection in the supersonic crossflow [7].
Figure 1.
Flow field structure of the shock wave/jet shear layer interaction for transverse injection in the supersonic crossflow [7].

Figure 2.
Schematic of the computational combustor [20].
Figure 2.
Schematic of the computational combustor [20].

Figure 3.
Schematic diagram of computing domain of fuel counter-flow jet.

Figure 4.
Grid diagram of computational domain and fuel injection orifice.

Figure 5.
Normalized comparison diagram under different orders of magnitude grids. (a) Diagram of x direction velocity. (b) Diagram of wall pressure.
Figure 5.
Normalized comparison diagram under different orders of magnitude grids. (a) Diagram of x direction velocity. (b) Diagram of wall pressure.

Figure 6.
Comparison of the contours. (a) Case1 the Mach number contour. (b) Case2 the Mach number contour. (c) Case2 pressure contours.
Figure 6.
Comparison of the contours. (a) Case1 the Mach number contour. (b) Case2 the Mach number contour. (c) Case2 pressure contours.

Figure 7.
Diagram near jet at z = 0 (a) pressure contour. Shock waves are signed in black. (b) hydrogen mass fraction contour and contour line with the flow velocity of 0.
Figure 7.
Diagram near jet at z = 0 (a) pressure contour. Shock waves are signed in black. (b) hydrogen mass fraction contour and contour line with the flow velocity of 0.

Figure 8.
Flow field structure diagram of Case3. (a) Mach number contour. (b) Hydrogen mass fraction contour and contour line.
Figure 8.
Flow field structure diagram of Case3. (a) Mach number contour. (b) Hydrogen mass fraction contour and contour line.

Figure 9.
Flow field structure near fuel injection on the lower wall of Case3.

Figure 10.
Flow field structure diagram of Case4. (a) Mach number contour. (b) Hydrogen mass fraction contour. (c) Diagram of streamline.
Figure 10.
Flow field structure diagram of Case4. (a) Mach number contour. (b) Hydrogen mass fraction contour. (c) Diagram of streamline.

Figure 11.
Mass fraction and streamline distribution of hydrogen at x/dj = 0, 2, 4, 6, 10, and 20 in Case 3 (a–f: lower wall, a’–f’: upper wall).
Figure 11.
Mass fraction and streamline distribution of hydrogen at x/dj = 0, 2, 4, 6, 10, and 20 in Case 3 (a–f: lower wall, a’–f’: upper wall).


Figure 12.
Q criterion iso-surface and x direction vorticity of each section.

Figure 13.
Hydrogen mass fraction and x direction vorticity of Case5, Case3, and Case7 at each section.
Figure 13.
Hydrogen mass fraction and x direction vorticity of Case5, Case3, and Case7 at each section.


Figure 14.
Comparison of mixing parameters along the flow direction of Case2, Case3, and Case4. (a) Total pressure recovery coefficient. (b) Mixing efficiency.
Figure 14.
Comparison of mixing parameters along the flow direction of Case2, Case3, and Case4. (a) Total pressure recovery coefficient. (b) Mixing efficiency.

Figure 15.
Comparison of mixing parameters along the flow direction of Case2, Case3, Case4, and Case7. (a) Total pressure recovery coefficient. (b) Mixing efficiency.
Figure 15.
Comparison of mixing parameters along the flow direction of Case2, Case3, Case4, and Case7. (a) Total pressure recovery coefficient. (b) Mixing efficiency.

Figure 16.
Comparison of mixing parameters along the flow direction of Case2, Case4, Case6, and Case8. (a) Total pressure recovery coefficient. (b) Mixing efficiency.
Figure 16.
Comparison of mixing parameters along the flow direction of Case2, Case4, Case6, and Case8. (a) Total pressure recovery coefficient. (b) Mixing efficiency.

Figure 17.
Comparison of mixing parameters along the flow direction of Case3, Case9, and Case10. (a) Total pressure recovery coefficient. (b) Mixing efficiency.
Figure 17.
Comparison of mixing parameters along the flow direction of Case3, Case9, and Case10. (a) Total pressure recovery coefficient. (b) Mixing efficiency.

Figure 18.
Comparison of the fuel penetration depth in various cases. (a) Fuel penetration depth on the lower wall of Case3, Case5, and Case7. (b) Fuel penetration depth on the upper wall of Case3, Case5, and Case7. (c) Fuel penetration depth on the lower wall of Case3, Case9, and Case10. (d) Fuel penetration depth on the upper wall of Case3, Case9, and Case10.

Figure 19.
Coordinate comparison of mixing length in various cases.

Figure 20.
The diagram of the hierarchical structure.


Table 1.
Inflow parameter table.
| Ma | T0 | P | The Thickness of the Boundary Layer δ | Re |
|---|---|---|---|---|
| 2.95 | 300 K | 2500 Pa | 6 mm | 35,000 |
Table 2.
Fuel jet parameter table.
| dj | Maj | P0,j | Pj | T0,j | J |
|---|---|---|---|---|---|
| 2 mm | 1.0 | 49,419.6 Pa | 26,107.5 Pa | 300 K | 1.2 |
Table 3.
Case table.
| Case | Fuel Injection Manner | Layout | Location of Shock Wave Interaction | |
|---|---|---|---|---|
| Case1 | single injection | \ | \ | \ |
| Case2 | Counter-flow jet | \ | \ | \ |
| Case3 | Counter-flow jet | unilateral | 20° | 0 mm |
| Case4 | Counter-flow jet | symmetrical | 20° | 0 mm |
| Case5 | Counter-flow jet | unilateral | 10° | 0 mm |
| Case6 | Counter-flow jet | symmetrical | 10° | 0 mm |
| Case7 | Counter-flow jet | unilateral | 30° | 0 mm |
| Case8 | Counter-flow jet | symmetrical | 30° | 0 mm |
| Case9 | Counter-flow jet | unilateral | 20° | −10 mm |
| Case10 | Counter-flow jet | unilateral | 20° | 10 mm |
Table 4.
Grid setting table.
| Case | Nx | Ny | Nz | Jet Orifice | Amount (Thousand) |
|---|---|---|---|---|---|
| Level-1 | 255 | 120 | 96 | 60 | 2278 |
| Level-2 | 260 | 151 | 120 | 80 | 4860 |
| Level-3 | 330 | 210 | 120 | 120 | 7611 |
Table 5.
Scale value table.
| Definition | |
|---|---|
| 1 | i is as important as j |
| 3 | i is slightly more important than j |
| 5 | i is more important than j |
| 7 | i is much more important than j |
| 9 | i is extremely important |
| 2,4,6,8 | It is the value corresponding to the intermediate state between the above judgments |
| Reciprocal | i is compared with j, the judgment value is: , |
Table 6.
Scale values table of mixing augmentation scheme.
| G | C1 | C2 | C3 | C4 |
|---|---|---|---|---|
| C1 | 1 | 2 | 5 | 3 |
| C2 | 1/2 | 1 | 3 | 2 |
| C3 | 1/5 | 1/3 | 1 | 1/3 |
| C4 | 1/3 | 1/2 | 3 | 1 |
Table 7.
Consistency test corresponding value table.
| n | 1 | 2 | 3 | 4 |
|---|---|---|---|---|
| RI | 0 | 0 | 0.58 | 0.90 |
Publisher’s Note: MDPI stays neutral with regard to jurisdictional claims in published maps and institutional affiliations. |
© 2022 by the authors. Licensee MDPI, Basel, Switzerland. This article is an open access article distributed under the terms and conditions of the Creative Commons Attribution (CC BY) license (https://creativecommons.org/licenses/by/4.0/).
Share and Cite
MDPI and ACS Style
Han, Y.; Shen, C.; Du, Z.; Tang, H. Numerical Study of the Induced Shock on the Mixing Augmentation of Hydrogen Counter-Flow Jet in the Supersonic Flow. Aerospace 2022, 9, 506. https://doi.org/10.3390/aerospace9090506
AMA Style
Han Y, Shen C, Du Z, Tang H. Numerical Study of the Induced Shock on the Mixing Augmentation of Hydrogen Counter-Flow Jet in the Supersonic Flow. Aerospace. 2022; 9(9):506. https://doi.org/10.3390/aerospace9090506
Chicago/Turabian StyleHan, Yi, Chibing Shen, Zhaobo Du, and Haoran Tang. 2022. "Numerical Study of the Induced Shock on the Mixing Augmentation of Hydrogen Counter-Flow Jet in the Supersonic Flow" Aerospace 9, no. 9: 506. https://doi.org/10.3390/aerospace9090506
Note that from the first issue of 2016, this journal uses article numbers instead of page numbers. See further details here.