SlideShare a Scribd company logo
1 of 2
Subhasish SutradharClassNote
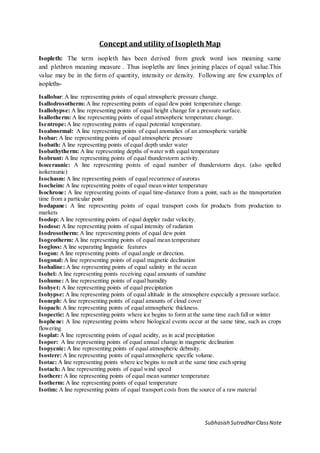
Concept and utility of Isopleth Map
Isopleth: The term isopleth has been derived from greek word isos meaning same
and plethron meaning measure . Thus isopleths are lines joining places of equal value.This
value may be in the form of quantity, intensity or density. Following are few examples of
isopleths-
Isallobar: A line representing points of equal atmospheric pressure change.
Isallodrosotherm: A line representing points of equal dew point temperature change.
Isallohypse: A line representing points of equal height change for a pressure surface.
Isallotherm: A line representing points of equal atmospheric temperature change.
Isentrope:A line representing points of equal potential temperature.
Isoabnormal: A line representing points of equal anomalies of an atmospheric variable
Isobar: A line representing points of equal atmospheric pressure
Isobath: A line representing points of equal depth under water
Isobathytherm: A line representing depths of water with equal temperature
Isobrunt: A line representing points of equal thunderstorm activity.
Isoceraunic: A line representing points of equal number of thunderstorm days. (also spelled
isokeraunic)
Isochasm: A line representing points of equal recurrence of auroras
Isocheim: A line representing points of equal mean winter temperature
Isochrone: A line representing points of equal time-distance from a point, such as the transportation
time from a particular point
Isodapane: A line representing points of equal transport costs for products from production to
markets
Isodop: A line representing points of equal doppler radar velocity.
Isodose: A line representing points of equal intensity of radiation
Isodrosotherm: A line representing points of equal dew point
Isogeotherm: A line representing points of equal mean temperature
Isogloss: A line separating linguistic features
Isogon: A line representing points of equal angle or direction.
Isogonal: A line representing points of equal magnetic declination
Isohaline: A line representing points of equal salinity in the ocean
Isohel: A line representing points receiving equal amounts of sunshine
Isohume: A line representing points of equal humidity
Isohyet: A line representing points of equal precipitation
Isohypse: A line representing points of equal altitude in the atmosphere especially a pressure surface.
Isoneph: A line representing points of equal amounts of cloud cover
Isopach: A line representing points of equal atmospheric thickness.
Isopectic: A line representing points where ice begins to form at the same time each fall or winter
Isophene: A line representing points where biological events occur at the same time, such as crops
flowering
Isoplat: A line representing points of equal acidity, as in acid precipitation
Isopor: A line representing points of equal annual change in magnetic declination
Isopycnic: A line representing points of equal atmospheric debnsity.
Isostere: A line representing points of equal atmospheric specific volume.
Isotac: A line representing points where ice begins to melt at the same time each spring
Isotach: A line representing points of equal wind speed
Isothere: A line representing points of equal mean summer temperature
Isotherm: A line representing points of equal temperature
Isotim: A line representing points of equal transport costs from the source of a raw material
Subhasish SutradharClassNote
Methods of Construction (Procedures):
1. Mark on the base map your observed values. Values should be located accurately at the
exactly position you collected the data or value, locate as more points of value as you can to
make accuracy at the end result.
2. Decide the suitable value or number for the isolines by looking the range you have
collected. Here, you work out on how many lines will fit properly on the map between your
maximum for and minimum values, but making a fixed interval is most important.
3. Join all places or points of equal value with smooth line in accordance to the interval you
have chosen. It is necessary to determine the values of intermediate points through which the
Isoline will pass using “logical interpolation”.
4. Check the accuracy of the construction quickly to see if there is no point omitted.
5. Show the key appropriate. And title to assist interpretation. Note, always a key used when
different shades or color has been used.
Applications of Isopleth Maps:
Isopleth maps used in different fields to show the equality of values. The following are
some of Isoline map’s applications,
1. Isopleth maps used in climatic data to show areas with the same temperature, pressure,
rainfalls etc.
2. Used in population or production data to show similarities between one area and another.
3. Used in showing altitude with the same height`s meters by using contour lines between one
area and another.
 Merits of Isopleth Technique:
1. Isopleth are more scientific than other methods of showing distribution and
effectively show the distribution and variations.
2. This is especially useful for climatic maps such as isobars, isotherms , isohyet etc.and
is known as the main tool for the meteorologists.
3. It is very easy to determine the gradient (rate of change )with the help of isopleth
maps.
4. When isopleth are wide apart ,they show low gradient but when they are
closer together they show high gradient.
5. Isopleth lines are independent of political boundaries and best suitet to show the
natural pattern of distribution of an element.
6. Isopleth is the most suited method for showing elements having transitional values
,this is a reason that isopleth are invariably used to show the distribution of
temperature ,pressure and other climatic elements.
 Demerits of Isopleth Technique :
1. Many isopleths are drawn by interpolation which sometimes lead to inaccuracy in the
directions of isopleths and the pattern of distribution shown by those lines is distorted.
2. It is confusing when there is large list of points or dots.
3. It is time consuming when there is large number of dots or points.

More Related Content

What's hot

System approach in Geography
System approach in GeographySystem approach in Geography
System approach in GeographyHimangshu Bailung
 
Scope and content of population geography
Scope and content of population geographyScope and content of population geography
Scope and content of population geographyMithun Ray
 
Numbering system of topographical map
Numbering system of topographical mapNumbering system of topographical map
Numbering system of topographical mapMithun Ray
 
Geometry of Aerial photograph
Geometry of Aerial photographGeometry of Aerial photograph
Geometry of Aerial photographApoorva Mathur
 
Cartographic symbology. By proj jasper
Cartographic symbology. By proj jasperCartographic symbology. By proj jasper
Cartographic symbology. By proj jasperAgbajiJacob
 
Distribution of maps
Distribution of mapsDistribution of maps
Distribution of mapsNaga Muruga
 
Models of landscape evolution and slope development by king
Models of landscape evolution and slope development by kingModels of landscape evolution and slope development by king
Models of landscape evolution and slope development by kingCharu Jaiswal
 
Principle of aerial photography and types.ppt
Principle of aerial photography and types.pptPrinciple of aerial photography and types.ppt
Principle of aerial photography and types.pptsrinivas2036
 
Quantitative revolution and phenomenology
Quantitative revolution and phenomenologyQuantitative revolution and phenomenology
Quantitative revolution and phenomenologyAsrafulMandal
 
CONTRIBUTION OF ARABS IN TO GEOGRAPHY
CONTRIBUTION OF ARABS IN TO GEOGRAPHYCONTRIBUTION OF ARABS IN TO GEOGRAPHY
CONTRIBUTION OF ARABS IN TO GEOGRAPHYABDUL MUHAIMIN K
 
Remote Sensing Platforms and Its types
Remote Sensing Platforms and Its typesRemote Sensing Platforms and Its types
Remote Sensing Platforms and Its typesSenthamizhan M
 
Temperate Cyclones
Temperate CyclonesTemperate Cyclones
Temperate CyclonesJohn Lanser
 
Introduction to spatial interaction modelling
Introduction to spatial interaction modellingIntroduction to spatial interaction modelling
Introduction to spatial interaction modellingUniversity of Southampton
 

What's hot (20)

System approach in Geography
System approach in GeographySystem approach in Geography
System approach in Geography
 
Themating maping
Themating mapingThemating maping
Themating maping
 
Scope and content of population geography
Scope and content of population geographyScope and content of population geography
Scope and content of population geography
 
Numbering system of topographical map
Numbering system of topographical mapNumbering system of topographical map
Numbering system of topographical map
 
Cartography
CartographyCartography
Cartography
 
Geometry of Aerial photograph
Geometry of Aerial photographGeometry of Aerial photograph
Geometry of Aerial photograph
 
Relief displacement
Relief displacementRelief displacement
Relief displacement
 
Coordinate systems
Coordinate systemsCoordinate systems
Coordinate systems
 
Cartographic symbology. By proj jasper
Cartographic symbology. By proj jasperCartographic symbology. By proj jasper
Cartographic symbology. By proj jasper
 
Distribution of maps
Distribution of mapsDistribution of maps
Distribution of maps
 
Models of landscape evolution and slope development by king
Models of landscape evolution and slope development by kingModels of landscape evolution and slope development by king
Models of landscape evolution and slope development by king
 
Principle of aerial photography and types.ppt
Principle of aerial photography and types.pptPrinciple of aerial photography and types.ppt
Principle of aerial photography and types.ppt
 
Quantitative revolution and phenomenology
Quantitative revolution and phenomenologyQuantitative revolution and phenomenology
Quantitative revolution and phenomenology
 
CONTRIBUTION OF ARABS IN TO GEOGRAPHY
CONTRIBUTION OF ARABS IN TO GEOGRAPHYCONTRIBUTION OF ARABS IN TO GEOGRAPHY
CONTRIBUTION OF ARABS IN TO GEOGRAPHY
 
History of GIS.pptx
History of GIS.pptxHistory of GIS.pptx
History of GIS.pptx
 
Remote sensing
Remote sensingRemote sensing
Remote sensing
 
Remote Sensing Platforms and Its types
Remote Sensing Platforms and Its typesRemote Sensing Platforms and Its types
Remote Sensing Platforms and Its types
 
Temperate Cyclones
Temperate CyclonesTemperate Cyclones
Temperate Cyclones
 
Introduction to spatial interaction modelling
Introduction to spatial interaction modellingIntroduction to spatial interaction modelling
Introduction to spatial interaction modelling
 
Postmodern Geography
Postmodern GeographyPostmodern Geography
Postmodern Geography
 

Similar to Concept of isopleth

Isolines and contour lines
Isolines and contour linesIsolines and contour lines
Isolines and contour lineslschmidt1170
 
Isolines and contour lines
Isolines and contour linesIsolines and contour lines
Isolines and contour lineslschmidt1170
 
Lab four isolines and contour lines
Lab four isolines and contour linesLab four isolines and contour lines
Lab four isolines and contour linesLisa Schmidt
 
Lab four isolines and contour lines
Lab four isolines and contour linesLab four isolines and contour lines
Lab four isolines and contour lineslschmidt1170
 
Isolines and contour lines
Isolines and contour linesIsolines and contour lines
Isolines and contour lineslschmidt1170
 
Manual Isodose Plotting
Manual Isodose Plotting Manual Isodose Plotting
Manual Isodose Plotting Hemant Vasan
 
Contour lines - Survey & Levelling
Contour lines - Survey & LevellingContour lines - Survey & Levelling
Contour lines - Survey & LevellingAr. Avitesh
 
Inquiry unit for science
Inquiry unit for scienceInquiry unit for science
Inquiry unit for scienceChaseWarner95
 
2018 tension minimizing economies are minimal surface economies august 2, 2017
2018 tension minimizing economies are minimal surface economies august 2, 20172018 tension minimizing economies are minimal surface economies august 2, 2017
2018 tension minimizing economies are minimal surface economies august 2, 2017Richard Anthony Baum
 
2018 tension minimizing econimies are minimal surface economies august 2, 2017
2018 tension minimizing econimies are minimal surface economies august 2, 20172018 tension minimizing econimies are minimal surface economies august 2, 2017
2018 tension minimizing econimies are minimal surface economies august 2, 2017Richard Anthony Baum
 
Kami export field maps and isolines lab
Kami export   field maps and isolines labKami export   field maps and isolines lab
Kami export field maps and isolines labJohnNowak25
 
1 ESO - UNIT 11 - GRAPHS AND TABLES. PROBABILITY.
1 ESO - UNIT 11 - GRAPHS AND TABLES. PROBABILITY.1 ESO - UNIT 11 - GRAPHS AND TABLES. PROBABILITY.
1 ESO - UNIT 11 - GRAPHS AND TABLES. PROBABILITY.Gogely The Great
 
FUNDAMENTALS OF PHYSICS.pptx
FUNDAMENTALS OF PHYSICS.pptxFUNDAMENTALS OF PHYSICS.pptx
FUNDAMENTALS OF PHYSICS.pptxMarlouMDeChavez
 
Choosing the Right Graphs
Choosing the Right GraphsChoosing the Right Graphs
Choosing the Right GraphsOdogray
 
Term Paper Coordinate Geometry
Term Paper Coordinate GeometryTerm Paper Coordinate Geometry
Term Paper Coordinate GeometryDurgesh singh
 
GEOLOGY of sticking dip and heaves to obtain
GEOLOGY of sticking dip and heaves to obtainGEOLOGY of sticking dip and heaves to obtain
GEOLOGY of sticking dip and heaves to obtainpurviewss
 

Similar to Concept of isopleth (19)

Isolines and contour lines
Isolines and contour linesIsolines and contour lines
Isolines and contour lines
 
Isolines and contour lines
Isolines and contour linesIsolines and contour lines
Isolines and contour lines
 
Lab four isolines and contour lines
Lab four isolines and contour linesLab four isolines and contour lines
Lab four isolines and contour lines
 
Lab four isolines and contour lines
Lab four isolines and contour linesLab four isolines and contour lines
Lab four isolines and contour lines
 
Isolines and contour lines
Isolines and contour linesIsolines and contour lines
Isolines and contour lines
 
Manual Isodose Plotting
Manual Isodose Plotting Manual Isodose Plotting
Manual Isodose Plotting
 
Earth's dimensions
Earth's dimensions Earth's dimensions
Earth's dimensions
 
Contour lines - Survey & Levelling
Contour lines - Survey & LevellingContour lines - Survey & Levelling
Contour lines - Survey & Levelling
 
Earth’s Positions
Earth’s  PositionsEarth’s  Positions
Earth’s Positions
 
Inquiry unit for science
Inquiry unit for scienceInquiry unit for science
Inquiry unit for science
 
2018 tension minimizing economies are minimal surface economies august 2, 2017
2018 tension minimizing economies are minimal surface economies august 2, 20172018 tension minimizing economies are minimal surface economies august 2, 2017
2018 tension minimizing economies are minimal surface economies august 2, 2017
 
2018 tension minimizing econimies are minimal surface economies august 2, 2017
2018 tension minimizing econimies are minimal surface economies august 2, 20172018 tension minimizing econimies are minimal surface economies august 2, 2017
2018 tension minimizing econimies are minimal surface economies august 2, 2017
 
Earths dimension sci 8 ppt np1
Earths dimension sci 8 ppt np1Earths dimension sci 8 ppt np1
Earths dimension sci 8 ppt np1
 
Kami export field maps and isolines lab
Kami export   field maps and isolines labKami export   field maps and isolines lab
Kami export field maps and isolines lab
 
1 ESO - UNIT 11 - GRAPHS AND TABLES. PROBABILITY.
1 ESO - UNIT 11 - GRAPHS AND TABLES. PROBABILITY.1 ESO - UNIT 11 - GRAPHS AND TABLES. PROBABILITY.
1 ESO - UNIT 11 - GRAPHS AND TABLES. PROBABILITY.
 
FUNDAMENTALS OF PHYSICS.pptx
FUNDAMENTALS OF PHYSICS.pptxFUNDAMENTALS OF PHYSICS.pptx
FUNDAMENTALS OF PHYSICS.pptx
 
Choosing the Right Graphs
Choosing the Right GraphsChoosing the Right Graphs
Choosing the Right Graphs
 
Term Paper Coordinate Geometry
Term Paper Coordinate GeometryTerm Paper Coordinate Geometry
Term Paper Coordinate Geometry
 
GEOLOGY of sticking dip and heaves to obtain
GEOLOGY of sticking dip and heaves to obtainGEOLOGY of sticking dip and heaves to obtain
GEOLOGY of sticking dip and heaves to obtain
 

Recently uploaded

Measures of Central Tendency: Mean, Median and Mode
Measures of Central Tendency: Mean, Median and ModeMeasures of Central Tendency: Mean, Median and Mode
Measures of Central Tendency: Mean, Median and ModeThiyagu K
 
Mastering the Unannounced Regulatory Inspection
Mastering the Unannounced Regulatory InspectionMastering the Unannounced Regulatory Inspection
Mastering the Unannounced Regulatory InspectionSafetyChain Software
 
Nutritional Needs Presentation - HLTH 104
Nutritional Needs Presentation - HLTH 104Nutritional Needs Presentation - HLTH 104
Nutritional Needs Presentation - HLTH 104misteraugie
 
SOCIAL AND HISTORICAL CONTEXT - LFTVD.pptx
SOCIAL AND HISTORICAL CONTEXT - LFTVD.pptxSOCIAL AND HISTORICAL CONTEXT - LFTVD.pptx
SOCIAL AND HISTORICAL CONTEXT - LFTVD.pptxiammrhaywood
 
The byproduct of sericulture in different industries.pptx
The byproduct of sericulture in different industries.pptxThe byproduct of sericulture in different industries.pptx
The byproduct of sericulture in different industries.pptxShobhayan Kirtania
 
Web & Social Media Analytics Previous Year Question Paper.pdf
Web & Social Media Analytics Previous Year Question Paper.pdfWeb & Social Media Analytics Previous Year Question Paper.pdf
Web & Social Media Analytics Previous Year Question Paper.pdfJayanti Pande
 
Beyond the EU: DORA and NIS 2 Directive's Global Impact
Beyond the EU: DORA and NIS 2 Directive's Global ImpactBeyond the EU: DORA and NIS 2 Directive's Global Impact
Beyond the EU: DORA and NIS 2 Directive's Global ImpactPECB
 
BASLIQ CURRENT LOOKBOOK LOOKBOOK(1) (1).pdf
BASLIQ CURRENT LOOKBOOK  LOOKBOOK(1) (1).pdfBASLIQ CURRENT LOOKBOOK  LOOKBOOK(1) (1).pdf
BASLIQ CURRENT LOOKBOOK LOOKBOOK(1) (1).pdfSoniaTolstoy
 
microwave assisted reaction. General introduction
microwave assisted reaction. General introductionmicrowave assisted reaction. General introduction
microwave assisted reaction. General introductionMaksud Ahmed
 
Grant Readiness 101 TechSoup and Remy Consulting
Grant Readiness 101 TechSoup and Remy ConsultingGrant Readiness 101 TechSoup and Remy Consulting
Grant Readiness 101 TechSoup and Remy ConsultingTechSoup
 
Activity 01 - Artificial Culture (1).pdf
Activity 01 - Artificial Culture (1).pdfActivity 01 - Artificial Culture (1).pdf
Activity 01 - Artificial Culture (1).pdfciinovamais
 
Disha NEET Physics Guide for classes 11 and 12.pdf
Disha NEET Physics Guide for classes 11 and 12.pdfDisha NEET Physics Guide for classes 11 and 12.pdf
Disha NEET Physics Guide for classes 11 and 12.pdfchloefrazer622
 
Kisan Call Centre - To harness potential of ICT in Agriculture by answer farm...
Kisan Call Centre - To harness potential of ICT in Agriculture by answer farm...Kisan Call Centre - To harness potential of ICT in Agriculture by answer farm...
Kisan Call Centre - To harness potential of ICT in Agriculture by answer farm...Krashi Coaching
 
JAPAN: ORGANISATION OF PMDA, PHARMACEUTICAL LAWS & REGULATIONS, TYPES OF REGI...
JAPAN: ORGANISATION OF PMDA, PHARMACEUTICAL LAWS & REGULATIONS, TYPES OF REGI...JAPAN: ORGANISATION OF PMDA, PHARMACEUTICAL LAWS & REGULATIONS, TYPES OF REGI...
JAPAN: ORGANISATION OF PMDA, PHARMACEUTICAL LAWS & REGULATIONS, TYPES OF REGI...anjaliyadav012327
 
Interactive Powerpoint_How to Master effective communication
Interactive Powerpoint_How to Master effective communicationInteractive Powerpoint_How to Master effective communication
Interactive Powerpoint_How to Master effective communicationnomboosow
 
The Most Excellent Way | 1 Corinthians 13
The Most Excellent Way | 1 Corinthians 13The Most Excellent Way | 1 Corinthians 13
The Most Excellent Way | 1 Corinthians 13Steve Thomason
 
POINT- BIOCHEMISTRY SEM 2 ENZYMES UNIT 5.pptx
POINT- BIOCHEMISTRY SEM 2 ENZYMES UNIT 5.pptxPOINT- BIOCHEMISTRY SEM 2 ENZYMES UNIT 5.pptx
POINT- BIOCHEMISTRY SEM 2 ENZYMES UNIT 5.pptxSayali Powar
 

Recently uploaded (20)

Measures of Central Tendency: Mean, Median and Mode
Measures of Central Tendency: Mean, Median and ModeMeasures of Central Tendency: Mean, Median and Mode
Measures of Central Tendency: Mean, Median and Mode
 
Mastering the Unannounced Regulatory Inspection
Mastering the Unannounced Regulatory InspectionMastering the Unannounced Regulatory Inspection
Mastering the Unannounced Regulatory Inspection
 
Nutritional Needs Presentation - HLTH 104
Nutritional Needs Presentation - HLTH 104Nutritional Needs Presentation - HLTH 104
Nutritional Needs Presentation - HLTH 104
 
SOCIAL AND HISTORICAL CONTEXT - LFTVD.pptx
SOCIAL AND HISTORICAL CONTEXT - LFTVD.pptxSOCIAL AND HISTORICAL CONTEXT - LFTVD.pptx
SOCIAL AND HISTORICAL CONTEXT - LFTVD.pptx
 
The byproduct of sericulture in different industries.pptx
The byproduct of sericulture in different industries.pptxThe byproduct of sericulture in different industries.pptx
The byproduct of sericulture in different industries.pptx
 
Web & Social Media Analytics Previous Year Question Paper.pdf
Web & Social Media Analytics Previous Year Question Paper.pdfWeb & Social Media Analytics Previous Year Question Paper.pdf
Web & Social Media Analytics Previous Year Question Paper.pdf
 
Beyond the EU: DORA and NIS 2 Directive's Global Impact
Beyond the EU: DORA and NIS 2 Directive's Global ImpactBeyond the EU: DORA and NIS 2 Directive's Global Impact
Beyond the EU: DORA and NIS 2 Directive's Global Impact
 
BASLIQ CURRENT LOOKBOOK LOOKBOOK(1) (1).pdf
BASLIQ CURRENT LOOKBOOK  LOOKBOOK(1) (1).pdfBASLIQ CURRENT LOOKBOOK  LOOKBOOK(1) (1).pdf
BASLIQ CURRENT LOOKBOOK LOOKBOOK(1) (1).pdf
 
microwave assisted reaction. General introduction
microwave assisted reaction. General introductionmicrowave assisted reaction. General introduction
microwave assisted reaction. General introduction
 
Grant Readiness 101 TechSoup and Remy Consulting
Grant Readiness 101 TechSoup and Remy ConsultingGrant Readiness 101 TechSoup and Remy Consulting
Grant Readiness 101 TechSoup and Remy Consulting
 
Activity 01 - Artificial Culture (1).pdf
Activity 01 - Artificial Culture (1).pdfActivity 01 - Artificial Culture (1).pdf
Activity 01 - Artificial Culture (1).pdf
 
Disha NEET Physics Guide for classes 11 and 12.pdf
Disha NEET Physics Guide for classes 11 and 12.pdfDisha NEET Physics Guide for classes 11 and 12.pdf
Disha NEET Physics Guide for classes 11 and 12.pdf
 
Kisan Call Centre - To harness potential of ICT in Agriculture by answer farm...
Kisan Call Centre - To harness potential of ICT in Agriculture by answer farm...Kisan Call Centre - To harness potential of ICT in Agriculture by answer farm...
Kisan Call Centre - To harness potential of ICT in Agriculture by answer farm...
 
Código Creativo y Arte de Software | Unidad 1
Código Creativo y Arte de Software | Unidad 1Código Creativo y Arte de Software | Unidad 1
Código Creativo y Arte de Software | Unidad 1
 
JAPAN: ORGANISATION OF PMDA, PHARMACEUTICAL LAWS & REGULATIONS, TYPES OF REGI...
JAPAN: ORGANISATION OF PMDA, PHARMACEUTICAL LAWS & REGULATIONS, TYPES OF REGI...JAPAN: ORGANISATION OF PMDA, PHARMACEUTICAL LAWS & REGULATIONS, TYPES OF REGI...
JAPAN: ORGANISATION OF PMDA, PHARMACEUTICAL LAWS & REGULATIONS, TYPES OF REGI...
 
Interactive Powerpoint_How to Master effective communication
Interactive Powerpoint_How to Master effective communicationInteractive Powerpoint_How to Master effective communication
Interactive Powerpoint_How to Master effective communication
 
Advance Mobile Application Development class 07
Advance Mobile Application Development class 07Advance Mobile Application Development class 07
Advance Mobile Application Development class 07
 
INDIA QUIZ 2024 RLAC DELHI UNIVERSITY.pptx
INDIA QUIZ 2024 RLAC DELHI UNIVERSITY.pptxINDIA QUIZ 2024 RLAC DELHI UNIVERSITY.pptx
INDIA QUIZ 2024 RLAC DELHI UNIVERSITY.pptx
 
The Most Excellent Way | 1 Corinthians 13
The Most Excellent Way | 1 Corinthians 13The Most Excellent Way | 1 Corinthians 13
The Most Excellent Way | 1 Corinthians 13
 
POINT- BIOCHEMISTRY SEM 2 ENZYMES UNIT 5.pptx
POINT- BIOCHEMISTRY SEM 2 ENZYMES UNIT 5.pptxPOINT- BIOCHEMISTRY SEM 2 ENZYMES UNIT 5.pptx
POINT- BIOCHEMISTRY SEM 2 ENZYMES UNIT 5.pptx
 

Concept of isopleth

  • 1. Subhasish SutradharClassNote Concept and utility of Isopleth Map Isopleth: The term isopleth has been derived from greek word isos meaning same and plethron meaning measure . Thus isopleths are lines joining places of equal value.This value may be in the form of quantity, intensity or density. Following are few examples of isopleths- Isallobar: A line representing points of equal atmospheric pressure change. Isallodrosotherm: A line representing points of equal dew point temperature change. Isallohypse: A line representing points of equal height change for a pressure surface. Isallotherm: A line representing points of equal atmospheric temperature change. Isentrope:A line representing points of equal potential temperature. Isoabnormal: A line representing points of equal anomalies of an atmospheric variable Isobar: A line representing points of equal atmospheric pressure Isobath: A line representing points of equal depth under water Isobathytherm: A line representing depths of water with equal temperature Isobrunt: A line representing points of equal thunderstorm activity. Isoceraunic: A line representing points of equal number of thunderstorm days. (also spelled isokeraunic) Isochasm: A line representing points of equal recurrence of auroras Isocheim: A line representing points of equal mean winter temperature Isochrone: A line representing points of equal time-distance from a point, such as the transportation time from a particular point Isodapane: A line representing points of equal transport costs for products from production to markets Isodop: A line representing points of equal doppler radar velocity. Isodose: A line representing points of equal intensity of radiation Isodrosotherm: A line representing points of equal dew point Isogeotherm: A line representing points of equal mean temperature Isogloss: A line separating linguistic features Isogon: A line representing points of equal angle or direction. Isogonal: A line representing points of equal magnetic declination Isohaline: A line representing points of equal salinity in the ocean Isohel: A line representing points receiving equal amounts of sunshine Isohume: A line representing points of equal humidity Isohyet: A line representing points of equal precipitation Isohypse: A line representing points of equal altitude in the atmosphere especially a pressure surface. Isoneph: A line representing points of equal amounts of cloud cover Isopach: A line representing points of equal atmospheric thickness. Isopectic: A line representing points where ice begins to form at the same time each fall or winter Isophene: A line representing points where biological events occur at the same time, such as crops flowering Isoplat: A line representing points of equal acidity, as in acid precipitation Isopor: A line representing points of equal annual change in magnetic declination Isopycnic: A line representing points of equal atmospheric debnsity. Isostere: A line representing points of equal atmospheric specific volume. Isotac: A line representing points where ice begins to melt at the same time each spring Isotach: A line representing points of equal wind speed Isothere: A line representing points of equal mean summer temperature Isotherm: A line representing points of equal temperature Isotim: A line representing points of equal transport costs from the source of a raw material
  • 2. Subhasish SutradharClassNote Methods of Construction (Procedures): 1. Mark on the base map your observed values. Values should be located accurately at the exactly position you collected the data or value, locate as more points of value as you can to make accuracy at the end result. 2. Decide the suitable value or number for the isolines by looking the range you have collected. Here, you work out on how many lines will fit properly on the map between your maximum for and minimum values, but making a fixed interval is most important. 3. Join all places or points of equal value with smooth line in accordance to the interval you have chosen. It is necessary to determine the values of intermediate points through which the Isoline will pass using “logical interpolation”. 4. Check the accuracy of the construction quickly to see if there is no point omitted. 5. Show the key appropriate. And title to assist interpretation. Note, always a key used when different shades or color has been used. Applications of Isopleth Maps: Isopleth maps used in different fields to show the equality of values. The following are some of Isoline map’s applications, 1. Isopleth maps used in climatic data to show areas with the same temperature, pressure, rainfalls etc. 2. Used in population or production data to show similarities between one area and another. 3. Used in showing altitude with the same height`s meters by using contour lines between one area and another.  Merits of Isopleth Technique: 1. Isopleth are more scientific than other methods of showing distribution and effectively show the distribution and variations. 2. This is especially useful for climatic maps such as isobars, isotherms , isohyet etc.and is known as the main tool for the meteorologists. 3. It is very easy to determine the gradient (rate of change )with the help of isopleth maps. 4. When isopleth are wide apart ,they show low gradient but when they are closer together they show high gradient. 5. Isopleth lines are independent of political boundaries and best suitet to show the natural pattern of distribution of an element. 6. Isopleth is the most suited method for showing elements having transitional values ,this is a reason that isopleth are invariably used to show the distribution of temperature ,pressure and other climatic elements.  Demerits of Isopleth Technique : 1. Many isopleths are drawn by interpolation which sometimes lead to inaccuracy in the directions of isopleths and the pattern of distribution shown by those lines is distorted. 2. It is confusing when there is large list of points or dots. 3. It is time consuming when there is large number of dots or points.