Markets
Animation: Population Pyramids of the 10 Largest Countries
China and India may have similar populations today, but they have very different demographic destinies.
While China should see its population fall in the coming decades, India projects to be the most populous country in 2050 by a long shot. By that time, India will have up to 1.7 billion people – and Mumbai will be the largest megacity in the world with upwards of 42 million people.
Comparing Population Pyramids
These kind of future trends are not evident from the base population figures alone, but they become much clearer when we look at the population pyramids of countries instead.
Today’s animated chart comes from PopulationPyramid.net, and it shows a breakdown for each of the 10 most populous countries in the world:
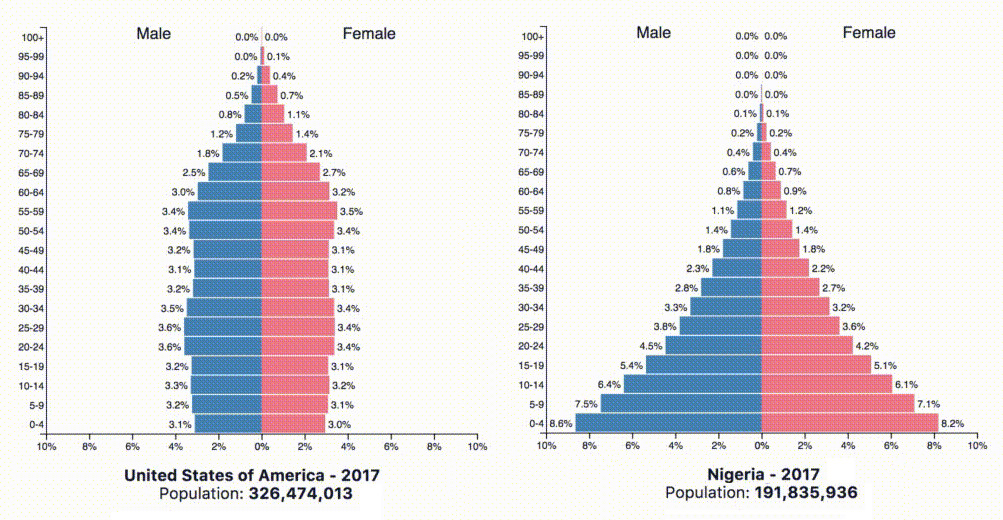
A population pyramid, which shows the distribution of a population in terms of age group and sex, can help us to see things like:
- How many people are being born?
- How long are people living?
- The age skew of the population
Analyzing these factors can give us an idea of the direction a country is trending, and whether it will continue to grow in terms of population.
Different Makeups
Below are three typical patterns for population growth: rapid, slow, and negative.
How do the population charts for the top 10 countries compare, using these kinds of classifications?
Rapid growth:
According to the above graphs, India, Indonesia, Nigeria, Mexico, Brazil, Bangladesh, and Pakistan will continue to grow their populations at a rapid pace. Nigeria is growing at a particularly fast rate, and by 2060 it will displace the U.S. as the third-largest country in the world by population.
Slow growth:
The United States stands out here as the only country in the top 10 experiencing tempered growth. That said, the U.N. sees the country hitting 400 million people around the year 2060 if trends continue.
Negative growth:
China, because of its One-Child Policy from 1979 to 2015, is not a surprise to see here.
However, Russia may be an intriguing mention in this category for many – the country has a low birth rate, a low immigration rate, and an unusually high death rate. In fact, Russia’s death rate is 15 people per 1,000 – almost twice that of the U.S. due to a high amount of alcohol-related deaths and emergencies.
Economic Progress and Population
The above classifications are mostly intuitive.
With the exception of China (and its self-inflicted wound from the One-Child Policy), the countries experiencing slower or negative growth are the ones with more mature economies.
This is something that can also be seen in this below graph:


Markets
Visualizing Global Inflation Forecasts (2024-2026)
Here are IMF forecasts for global inflation rates up to 2026, highlighting a slow descent of price pressures amid resilient global growth.


Visualizing Global Inflation Forecasts (2024-2026)
Global inflation rates are gradually descending, but progress has been slow.
Today, the big question is if inflation will decline far enough to trigger easing monetary policy. So far, the Federal Reserve has held rates for nine months amid stronger than expected core inflation, which excludes volatile energy and food prices.
Yet looking further ahead, inflation forecasts from the International Monetary Fund (IMF) suggest that inflation will decline as price pressures ease, but the path of disinflation is not without its unknown risks.
This graphic shows global inflation forecasts, based on data from the April 2024 IMF World Economic Outlook.
Get the Key Insights of the IMF’s World Economic Outlook
Want a visual breakdown of the insights from the IMF’s 2024 World Economic Outlook report?
This visual is part of a special dispatch of the key takeaways exclusively for VC+ members.
Get the full dispatch of charts by signing up to VC+.
The IMF’s Inflation Outlook
Below, we show the IMF’s latest projections for global inflation rates through to 2026:
| Year | Global Inflation Rate (%) | Advanced Economies Inflation Rate (%) | Emerging Market and Developing Economies Inflation Rate (%) |
|---|---|---|---|
| 2019 | 3.5 | 1.4 | 5.1 |
| 2020 | 3.2 | 0.7 | 5.2 |
| 2021 | 4.7 | 3.1 | 5.9 |
| 2022 | 8.7 | 7.3 | 9.8 |
| 2023 | 6.8 | 4.6 | 8.3 |
| 2024 | 5.9 | 2.6 | 8.3 |
| 2025 | 4.5 | 2.0 | 6.2 |
| 2026 | 3.7 | 2.0 | 4.9 |
After hitting a peak of 8.7% in 2022, global inflation is projected to fall to 5.9% in 2024, reflecting promising inflation trends amid resilient global growth.
While inflation has largely declined due to falling energy and goods prices, persistently high services inflation poses challenges to mitigating price pressures. In addition, the IMF highlights the potential risk of an escalating conflict in the Middle East, which could lead to energy price shocks and higher shipping costs.
These developments could negatively affect inflation scenarios and prompt central banks to adopt tighter monetary policies. Overall, by 2026, global inflation is anticipated to decline to 3.7%—still notably above the 2% target set by several major economies.
Adding to this, we can see divergences in the path of inflation between advanced and emerging economies. While affluent nations are forecast to see inflation edge closer to the 2% target by 2026, emerging economies are projected to have inflation rates reach 4.9%—falling closer to their pre-pandemic averages.
Get the Full Analysis of the IMF’s Outlook on VC+
This visual is part of an exclusive special dispatch for VC+ members which breaks down the key takeaways from the IMF’s 2024 World Economic Outlook.
For the full set of charts and analysis, sign up for VC+.

-

 Culture7 days ago
The World’s Top Media Franchises by All-Time Revenue
-

 Science2 weeks ago
Visualizing the Average Lifespans of Mammals
-

 Brands2 weeks ago
How Tech Logos Have Evolved Over Time
-

 Energy2 weeks ago
Ranked: The Top 10 EV Battery Manufacturers in 2023
-

 Countries2 weeks ago
Countries With the Largest Happiness Gains Since 2010
-

 Economy2 weeks ago
VC+: Get Our Key Takeaways From the IMF’s World Economic Outlook
-

 Demographics2 weeks ago
The Countries That Have Become Sadder Since 2010
-

 Money2 weeks ago
Charted: Who Has Savings in This Economy?